
More Information
Submitted: August 08, 2026 | Accepted: August 18, 2026 | Published: August 20, 2026
Citation: Bilić-Komarica E. Risk Factors and Their Impact on Diabetes Mellitus in Elderly People. Ann Clin Endocrinol Metabol. 2026; 10(1): 34-39. Available from:
https://dx.doi.org/10.29328/journal.acem.1001036.
DOI: 10.29328/journal.acem.1001036
Copyright License: © 2026 Bilić-Komarica E. This is an open access article distributed under the Creative Commons Attribution License, which permits unrestricted use, distribution, and reproduction in any medium, provided the original work is properly cited.
Keywords: Diabetes mellitus; Risk factors; Elderly patients; Genetic factors; Environmental factors; Obesity

Risk Factors and Their Impact on Diabetes Mellitus in Elderly People
Edina Bilić-Komarica*
Molecular Biology Laboratory, Investigation Department, Institute of Oncology and Radiobiology, Havana, Cuba
*Corresponding author: Edina Bilić-Komarica, UKC Sarajevo, Bosnia and Herzegovina, Email: [email protected]
Diabetes mellitus is a metabolic disorder characterized by chronic hyperglycemia and disrupted carbohydrate, fat, and protein metabolism, representing a growing health issue in Bosnia and Herzegovina, particularly among the elderly. This study evaluated the accumulation and distribution of identified risk factors among 108 elderly patients with type 2 diabetes (54 females and 54 males) treated at the Clinical Center University of Sarajevo. Evaluated risk factors included age, sex, hyperlipidemia, adiposity, family history, smoking, hypertension, and elevated fibrinogen levels. The overall mean number of identified risk factors was 4.11 per patient (SD = 1.32, range: 1–8). Female patients exhibited a slightly higher mean (4.26, SD = 1.36) than male patients (3.96, SD = 1.27), but this difference was not statistically significant (t = 1.18, df = 106, p = 0.240). Overall, 80.56% of patients presented with 3–5 risk factors, 12.04% with 6 or more, and only 7.41% with 2 or fewer, showing no significant association between sex and risk burden category (p = 0.670). In conclusion, elderly patients with type 2 diabetes exhibit a high cumulative risk-factor burden that is comparable between sexes, underscoring the need for comprehensive, multi-targeted intervention strategies in clinical practice.
Diabetes mellitus is one of the major chronic metabolic disorders worldwide, with type 2 diabetes mellitus (T2DM) accounting for the majority of diabetes cases in adults. The global burden of diabetes has increased substantially in recent decades, with population ageing, increasing obesity, and changes in lifestyle contributing to this trend. T2DM is particularly important among older adults, in whom diabetes commonly occurs together with other chronic conditions and is associated with an increased risk of cardiovascular and other complications [1-4].
The development of T2DM is multifactorial and results from the interaction of genetic susceptibility with demographic, metabolic, and lifestyle-related factors. Increasing age, adiposity, hypertension, dyslipidemia, physical inactivity, smoking, and a family history of diabetes have been identified as important risk factors for T2DM [5-7]. The coexistence of several risk factors in the same individual may increase the overall risk of diabetes and its associated complications. Sex-related differences have also been described in the prevalence, pathophysiology, and complications of T2DM, indicating that assessment of risk-factor burden according to sex may provide clinically relevant information [8]. Cardiovascular risk factors, including hypertension, obesity, and lipid abnormalities, are also common among populations in Bosnia and Herzegovina [9,10].
Despite the increasing global burden of diabetes, information regarding the distribution and coexistence of multiple risk factors among elderly patients with diabetes mellitus in Bosnia and Herzegovina remains limited. Previous research in the Bosnian population has examined risk factors for T2DM and other chronic non-communicable diseases, highlighting the importance of continued assessment of modifiable risk factors in the local population [9,11]. Therefore, the present study aimed to investigate the number and distribution of selected risk factors among elderly patients with diabetes mellitus treated at the Clinical Center of the University of Sarajevo, with particular attention to differences between female and male patients. The findings may contribute to a better understanding of the cumulative risk-factor burden in elderly patients and support more comprehensive approaches to clinical assessment and prevention.
Study design and participants
A retrospective clinical study was conducted using data obtained from the medical records of 108 elderly patients with diabetes mellitus who were treated at the Clinic for Endocrinology, Diabetes and Metabolism of the Clinical Center of the University of Sarajevo (KCUS) during 2006. The study population comprised 54 female and 54 male patients.
Patients were selected from the available medical records according to predefined eligibility criteria. Inclusion criteria were a documented diagnosis of diabetes mellitus, treatment or clinical evaluation at the study site during the study period, and availability of sufficient demographic and clinical information for the assessment of the selected risk factors. Patients with incomplete or insufficient information for the assessment of a particular variable were excluded from the corresponding analysis.
The individual patient was the primary unit of analysis. Demographic and clinical information recorded in the medical documentation was reviewed to determine the presence of predefined risk factors. For each patient, the total number of identified risk factors was calculated by summing the documented risk-factor indicators. This measure was subsequently used in the descriptive and comparative analyses. The sex distribution of the study participants is presented in Figure 1.
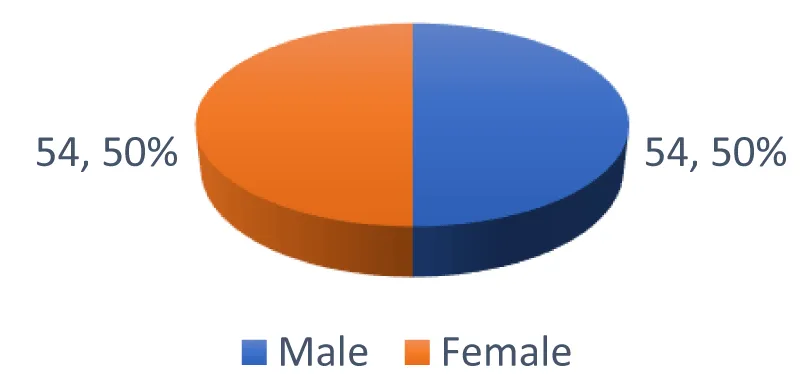
Figure 1: Distribution of study participants according to sex.
Ethical considerations
The study was approved by the Ethics Committee of the Clinical Center of the University of Sarajevo (KCUS) under approval reference number ______________________, dated ______________________. The study was conducted in accordance with the ethical principles governing research involving human participants and the principles of the Declaration of Helsinki. The requirement for informed consent was waived by the Ethics Committee because the study involved a retrospective review of existing medical records and no additional procedures or interventions were performed.
KLIJENTICA MORA DOPUNITI!!!
Data collection and study variables
Data were obtained retrospectively from the available medical records of the included patients. The collected information comprised demographic, clinical, and laboratory variables relevant to the assessment of selected risk factors associated with diabetes mellitus. The variables assessed in the study included age, sex, hyperlipidemia, adiposity, family history of diabetes, hypertension, genetic predisposition, elevated fibrinogen level, smoking, and physical inactivity. For each participant, the documented presence or absence of each predefined risk-factor indicator was recorded based on the information available in the medical records.
Each factor was assessed using the clinical or laboratory information documented for the individual patient. Categorical variables were recorded according to whether the corresponding risk-factor criterion was present or absent. The total number of identified risk factors was calculated for each patient by summing the individual risk-factor indicators. Each documented risk factor contributed one unit to the cumulative score.
The resulting value represented the total number of identified risk factors for an individual patient and was subsequently used for descriptive and comparative analyses between female and male participants. The distribution of individual risk factors in the study population was summarized according to sex. The frequencies and percentages of each identified risk factor among female and male patients were used to describe the overall risk-factor profile of the study population.
Statistical analysis
Descriptive statistical methods were used to summarize the distribution of the identified risk factors in the study population. Continuous variables (total number of risk factors per patient) were summarized using the arithmetic mean, median, mode, range, variance, standard deviation (SD), and coefficient of variation (CV). Categorical variables were expressed as absolute frequencies and percentages with 95% confidence intervals (95% CI).
To compare the mean number of identified risk factors between female and male patients, an independent-samples t-test with pooled variance was performed. The pooled variance and t-statistic were calculated based on the standard formulas for two independent sample means.
Categorical risk-factor burden was evaluated using Pearson’s chi-square test with 2x2 contingency tables. Multivariate logistic regression was conducted to identify independent predictors of high risk-factor accumulation (4 or more risk factors) while controlling for confounders. Effect sizes were reported using Cohen’s d for continuous comparisons and Odds Ratios (OR) with 95% CIs for categorical associations. All statistical tests were two-sided, with p < 0.05 considered statistically significant. All decimal values consistently used period separators.
Overall distribution of risk factors
The overall distribution of the number of identified risk factors among the 108 patients is presented in Table 1. The arithmetic mean was 4.11 risk factors per patient, while both the median and mode were 4. The observed range was 7, with the number of identified risk factors ranging from 1 to 8.
| Table 1: Distribution of selected risk factors among female and male patients. | |||
| Risk factor | Female, n (%) | Male, n (%) | Total, n (%) |
| Hyperlipidemia | 44 (81.48) | 40 (74.07) | 84 (77.78) |
| Adiposity | 42 (77.78) | 39 (72.22) | 81 (75.00) |
| Family history of diabetes | 34 (62.96) | 30 (55.56) | 64 (59.26) |
| Hypertension | 38 (70.37) | 26 (48.15) | 64 (59.26) |
| Genetic predisposition | 32 (59.26) | 28 (51.85) | 60 (55.56) |
| Fibrinogen level | 22 (40.74) | 18 (33.33) | 40 (37.04) |
| Smoking | 12 (22.22) | 24 (44.44) | 36 (33.33) |
| Physical inactivity | 6 (11.11) | 9 (16.67) | 15 (13.89) |
| Total number of risk-factor occurrences | 230 | 214 | 444 |
Measures of dispersion were also calculated to further describe the distribution of the identified risk factors in the study population. The calculated measures included:
- Variation range RV = 8-1 = 7
- Variance d2 1.73
- Standard deviation d = 1.31
- Coefficient of variation V = 32%
Based on the distribution of the total number of identified risk factors, the patients were additionally classified into three groups: those with two or fewer risk factors (≤2), those with three to five risk factors (3–5), and those with six or more risk factors (≥6). This classification was used to provide a clearer description of the distribution of risk-factor burden among the study participants.
A total of 8 patients (7.41%) had two or fewer identified risk factors. The largest proportion of the study population, comprising 87 patients (80.56%), had between three and five risk factors. This group therefore represented the predominant category in the study population and indicates that most patients had multiple identified risk factors. In addition, 13 patients (12.04%) had six or more identified risk factors, representing the group with the highest risk-factor burden. The three categories together accounted for all 108 patients (100%) included in the analysis.
| Table 2: Frequency and cumulative distribution of the number of identified risk factors. | ||||
| Risk factors | Number of active FR | Cumulative | ||
| X | F | Xf | (x-)² f | |
| 1 | 4 | 4 | 38.72 | 4 |
| 2 | 4 | 8 | 17.79 | 8 |
| 3 | 25 | 75 | 30.86 | 33 |
| 4 | 37 | 148 | 0.46 | 70 |
| 5 | 25 | 125 | 19.76 | 95 |
| 6 | 9 | 54 | 32.11 | 104 |
| 7 | 2 | 14 | 16.68 | 106 |
| 8 | 2 | 16 | 30.25 | 108 |
| 108 | 444 | 186.67 | ||
The distribution of patients according to the predefined risk-factor categories showed that 8 patients (7.41%) had ≤2 risk factors, 87 patients (80.56%) had 3–5 risk factors, and 13 patients (12.04%) had ≥6 risk factors. Thus, the majority of patients had between three and five identified risk factors (Figure 2).
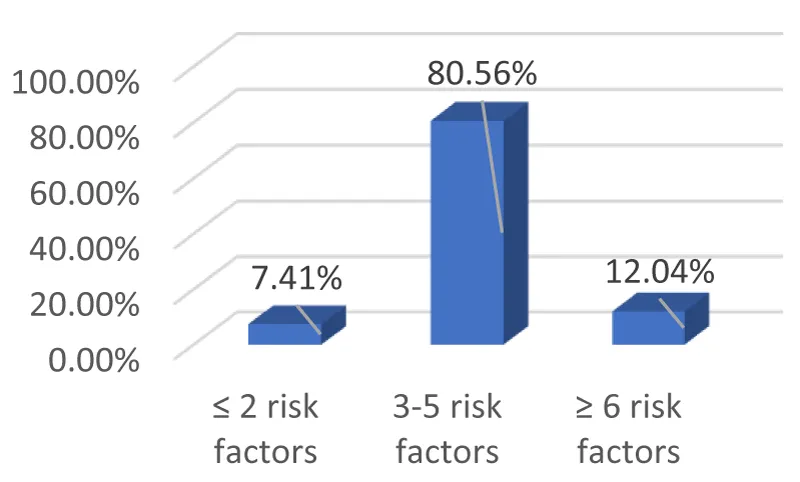
Figure 2: Distribution of patients according to the number of identified risk factors.
Distribution according to sex
The distribution of the number of identified risk factors was separately analyzed for female (n1 = 54) and male (n2 = 54) subgroups, as shown in Tables 3 and 4.
| Table 3: Frequency and distribution of identified risk factors among female patients. | ||||
| X | f | Xf | (X − X̄)²f | Cumulative |
| 1 | 2 | 2 | 21.02 | 2 |
| 2 | 2 | 4 | 10.08 | 4 |
| 3 | 9 | 27 | 13.31 | 13 |
| 4 | 20 | 80 | 1.17 | 33 |
| 5 | 13 | 65 | 7.45 | 46 |
| 6 | 5 | 30 | 15.52 | 51 |
| 7 | 2 | 14 | 15.21 | 53 |
| 8 | 1 | 8 | 14.10 | 54 |
| Total | 54 | 230 | 98.37 | 54 |
| Table 4: Frequency and distribution of identified risk factors among male patients. | ||||
| X | f | Xf | (X − X̄)²f | Cumulative |
| 1 | 2 | 2 | 17.90 | 2 |
| 2 | 2 | 4 | 7.57 | 4 |
| 3 | 16 | 48 | 15.93 | 20 |
| 4 | 17 | 68 | 0.00 | 37 |
| 5 | 12 | 60 | 12.07 | 49 |
| 6 | 4 | 24 | 16.60 | 53 |
| 7 | 0 | 0 | 0.00 | 53 |
| 8 | 1 | 8 | 16.24 | 54 |
| Total | 54 | 214 | 85.93 | 54 |
Female
Male
For Women
For Male
Among female patients, the mean number of identified risk factors was 4.26, compared with 3.96 among male patients. The corresponding standard deviations were 1.34 and 1.26, respectively.
The corresponding pooled standard deviation was:
Comparison between female and male patients
The t-value was then calculated as:
The difference in the mean number of identified risk factors between female and male patients was assessed using an independent-samples t-test with pooled variance. The mean was 4.26 among female patients and 3.96 among male patients. The calculated t-value was 1.18. Since this value was below the critical value of 1.96 for a two-tailed test at the 0.05 significance level, the difference was not statistically significant (p > 0.05).
Patients were categorized into high risk-factor burden (≥4 active risk factors) and low risk-factor burden (< 4 active risk factors) to assess sex-based categorical associations using a 2x2 contingency Table 5.
| Table 5: 2x2 contingency table for risk-factor burden by sex. | |||
| Sex | High Risk Burden (≥4 factors) | Low Risk Burden (<4 factors) | Total |
| Female | 41 (75.93%) | 13 (24.07%) | 54 (100.0%) |
| Male | 34 (62.96%) | 20 (37.04%) | 54 (100.0%) |
| Total | 75 (69.44%) | 33 (30.56%) | 108 (100.0%) |
Pearson’s chi-square test yielded a chi-square value of:
χ² = 2.182, df = 1, p = 0.140, X̄)²= 1.603, p = 0.205).
Odds Ratio (OR): Female patients had higher odds of presenting with 4 or more risk factors compared to male patients, with an Odds Ratio (OR) of 1.86 (95% CI: 0.80 to 4.29), though this difference did not reach statistical significance.
Association between sex and risk-factor burden category
Based on the analysis of differences in the mean number of identified risk factors between female and male elderly patients with diabetes mellitus, no statistically significant difference was found between the two groups.
To further assess the distribution of patients according to the number of identified risk factors, patients were classified into three categories according to their total number of identified risk factors: ≤2, 3–5, and ≥6 risk factors. The observed frequencies in each category according to sex are presented in Table 6.
| Table 6: Distribution of patients according to sex and risk-factor burden category. | |||
| Number of risk factors | Female | Male | Total |
| ≤2 | 4 | 4 | 8 |
| 3–5 | 42 | 45 | 87 |
| ≥6 | 8 | 5 | 13 |
| Total | 54 | 54 | 108 |
A Pearson’s chi-square test was performed to determine whether an association existed between sex and the category of risk-factor burden. The analysis yielded a chi-square value of 0.80 with 2 degrees of freedom (df = 2, p = 0.670).
Because the p-value was greater than 0.05, there was no statistically significant association between sex and risk-factor burden category. The proportion of patients falling into the low, moderate, and high risk-factor burden groups was comparable between female and male elderly patients with diabetes mellitus.
The present study evaluated the accumulation and distribution of identified risk factors among elderly patients with diabetes mellitus. The principal finding of this study is the high cumulative burden of risk factors in the evaluated population, with an overall mean of 4.11 (SD = 1.32) risk factors per patient and 80.56% of patients presenting with moderate risk-factor accumulation (3 to 5 factors). These findings align with global epidemiological data highlighting the complex clinical presentation of diabetes in older age groups.
The high average number of risk factors observed in our sample reflects the global surge in diabetes prevalence and its related multimorbidity among older populations, as described in international epidemiological reports [12,2]. In regional clinical practice, high rates of non-communicable disease risk factors have been documented across primary care and family medicine settings [9,10]. Previous studies in the region identified a high baseline aggregation of metabolic and lifestyle risk factors in patients assessed for type 2 diabetes [11], which directly supports our observation that over 92% of elderly diabetic patients present with three or more active risk factors.
Comprehensive reviews and medical literature have established that type 2 diabetes rarely occurs in isolation [5-7]. Individual risk factors such as hypertension, dyslipidemia, physical inactivity, advanced age, and metabolic alterations act synergistically to increase microvascular and macrovascular vulnerability. Early identification of vascular damage, such as microalbuminuria, is crucial in preventing irreversible renal and cardiovascular complications [13]. The high risk-factor burden observed in our cohort underscores the urgent necessity for comprehensive early screening protocol adoption in primary care.
An essential aspect of our analysis was comparing the risk-factor burden between female and male patients. While female patients exhibited a slightly higher mean number of risk factors (4.26, SD = 1.36) compared to male patients (3.96, SD = 1.27), this difference did not reach statistical significance (t = 1.18, df = 106, p = 0.240, Cohen’s d = 0.228). Similarly, categorical evaluation using chi-square analysis revealed no significant association between sex and risk-factor burden categories (chi-square = 0.80, df = 2, p = 0.670), nor between sex and high risk-factor burden threshold of 4 or more factors (chi-square = 2.18, df = 1, p = 0.140, OR = 1.86, 95% CI: 0.80–4.29).
These results are consistent with sex-and-gender differences documented in the diabetes literature [8]. Although postmenopausal women frequently present with altered adiposity distribution, heightened insulin resistance, and elevated cardiovascular risk profiles, the aggregate burden of metabolic risk factors in older populations often equilibrates between sexes due to shared age-related pathophysiological decline.
Our findings strongly align with the current clinical practice guidelines published by the American Diabetes Association [1,3,4]. These standards of care specifically highlight the necessity of individualized risk assessment in older adults [1], optimal management of cardiovascular disease and metabolic risk factors [4], and structured prevention strategies for diabetes-associated comorbidities [3]. Managing complex risk profiles in elderly diabetic patients requires an integrated, multi-targeted therapeutic approach rather than focusing solely on glycemic control. Addressing acute complications such as hypoglycemia is equally vital, as acute glycemic instability severely impacts quality of life and functional capacity in older individuals [14].
Limitations of the study: Several limitations should be considered when interpreting these findings. First, the sample size was limited to 108 patients from a single regional center, which may restrict the generalizability of the findings to broader populations. Second, the cross-sectional design precludes establishing causal relationships between specific risk factors and long-term diabetic outcomes. Third, reliance on medical records and patient reporting may introduce potential information bias regarding lifestyle-related risk factors.
This study demonstrated a substantial burden of multiple risk factors among elderly patients with diabetes mellitus. The mean number of identified risk factors was 4.11 per patient, with a median and mode of 4. Most patients (80.56%) had between three and five identified risk factors, indicating a substantial cumulative risk-factor burden in the study population. These findings are consistent with the multifactorial nature of diabetes mellitus described in the existing literature, in which metabolic, genetic, lifestyle, and cardiovascular risk factors commonly coexist.
Female patients had a slightly higher mean number of identified risk factors than male patients (4.26 vs. 3.96), but this difference was not statistically significant (t = 1.18, p > 0.05). Similarly, no statistically significant association was found between sex and risk-factor burden category (χ² = 0.80, df = 2, p = 0.67). These findings suggest that the overall burden and distribution of identified risk factors were comparable between female and male patients in this study population.
The findings should be interpreted in light of several limitations, including the relatively small sample size (n = 108), single-center design, retrospective study design, and absence of multivariate analysis, which limits generalizability and prevents assessment of the independent effects of individual risk factors. Nevertheless, the results emphasize the importance of comprehensive risk-factor assessment and management in elderly patients with diabetes mellitus. Future research should involve larger, multicenter and prospective studies, with multivariate analysis to identify independent predictors and better inform individualized prevention and clinical management strategies.
- American Diabetes Association Professional Practice Committee for Diabetes. 13. Older Adults: Standards of Care in Diabetes-2026. Diabetes Care. 2026;49(Suppl 1). Available from: https://dx.doi.org/10.2337/dc26-S013.
- International Diabetes Federation. IDF Diabetes Atlas. 11th ed. Brussels, Belgium: International Diabetes Federation; 2025.
- American Diabetes Association Professional Practice Committee for Diabetes. 3. Prevention or Delay of Diabetes and Associated Comorbidities: Standards of Care in Diabetes-2026. Diabetes Care. 2026;49(Suppl 1). Available from: https://dx.doi.org/10.2337/dc26-S003.
- American Diabetes Association Professional Practice Committee for Diabetes. 10. Cardiovascular Disease and Risk Management: Standards of Care in Diabetes-2026. Diabetes Care. 2026;49(Suppl 1). Available from: https://dx.doi.org/10.2337/dc26-S010.
- Tahirovi F H. Seerna bolest, Medicinski fakultet, Tuzla, 2004. 12,13,19,20,152-154
- Bellou V, Belbasis L, Tzoulaki I, Evangelou E. Risk factors for type 2 diabetes mellitus: an exposure-wide umbrella review of meta-analyses. PLoS One. 2018;13(3). Available from: https://dx.doi.org/10.1371/journal.pone.0194127.
- Ley SH, Schulze MB, Hivert MF, Meigs JB, Hu FB. Risk factors for type 2 diabetes. In: Cowie CC, Casagrande SS, Menke A, et al., editors. Diabetes in America. 3rd ed. Bethesda (MD): National Institute of Diabetes and Digestive and Kidney Diseases; 2018.
- Kautzky-Willer A, Harreiter J, Pacini G. Sex and gender differences in risk, pathophysiology and complications of type 2 diabetes mellitus. Endocr Rev. 2016;37(3):278-316. Available from: https://doi.org/10.1210/er.2015-1137
- Hrabac B, Spasojevic N. Non-communicable chronic diseases risk prevalence of family medicine patients in the Federation of Bosnia and Herzegovina. Mater Sociomed. 2016;28(2):93-98. Available from: https://dx.doi.org/10.5455/msm.2016.28.93-98.
- Zildži? M, et al. Ten year trends in cardiovascular risk factors in the Federation of Bosnia and Herzegovina. Med Arch. 2014;68(6):394-398. Available from: https://dx.doi.org/10.5455/medarh.2014.68.394-398.
- ustovi A, et al. Assessment of risk factors for diabetes mellitus type 2. Med Arch. 2016;70(4):282-286.
- Centers for Disease Control and Prevention. National diabetes fact sheet: national estimates and general information on diabetes and prediabetes in the United States, 2011. Atlanta, GA: US department of health and human services, centers for disease control and prevention, 201(1), 2568-2569.
- Dragovi, Tamara, Microalbuminuria in diabetes: definition, identification techniques, and the significance of early recognition, Beograd, 2006. 1027- 1031.
- Davis RE., Morrissey M, Peters JR, Wittrup-Jensen K, Kennedy-Martin T, Currie CJ. Impact of hypoglycaemia on quality of life and productivity in type 1 and type 2 diabetes. Curr Med Res Opin. 2005; 21(9): 1477-1483. Available from: https://doi.org/10.1185/030079905x61929