
More Information
Submitted: January 18, 2021 | Approved: February 25, 2021 | Published: March 01, 2021
How to cite this article: Melek HE, Ergür AT, Ataç GK. Evaluation of endothelial function in obese children and adolescents. Ann Clin Endocrinol Metabol. 2021; 5: 014-023.
DOI: 10.29328/journal.acem.1001019
Copyright License: © 2021 Melek HE, et al. This is an open access article distributed under the Creative Commons Attribution License, which permits unrestricted use, distribution, and reproduction in any medium, provided the original work is properly cited.
Keywords: Childhood and adolescent obesity; Endothelial dysfunction

Evaluation of endothelial function in obese children and adolescents
Hacer Efnan Melek1, Ayça Törel Ergür2* and Gökçe Kaan Ataç3
1Pediatric Specialist, Faculty of Medicine, Department of Pediatrics, Ufuk University, Turkey
2Professor, Faculty of Medicine, Department of Pediatric Endocrinology, Ufuk University, Turkey
3Professor, Faculty of Medicine, Department of Radiology, Ufuk University, Turkey
*Address for Correspondence: Dr. Ayça Törel Ergür, Professor, Faculty of Medicine, Department of Pediatric Endocrinology, Ufuk University, Turkey, Tel: 05336917628; Email: [email protected]
Introduction: Obesity defined as increased fatty mass is progressively rising in recently, even though its affects begins to all systems in childhood and adolescence periods, the most important morbidity and mortality reason of obesity is its effects on the cardiovascular system. Researches point out endothelial dysfunction and atherosclerosis as the reason of the cardiovascular system disease in obesity. The studies conducted on childhood period related to this subject are highly limited and the results of these are also controversial. Therefore in our study the effects of obesity on endothelial functions in children and adolescents was assessed by flow mediated dilation (FMD) method. In addition to that, effects of epidemiological, biochemical, hormonal and clinical features of cases to FMD were investigated.
Material and method: A total number of 104 cases were cover in this study. Obese group (group 1) was consisted of 59 children whose body mass index (BMI) was ≥ 95th percentile and mean age was 12 ± 2.8 years old. The control group (group 2) consisted of 45 children whose body mass index (BMI) was between 25th -84th percentil and mean age was 11.4 ± 2.9 years old. The detailed history, epidemiological data and physical examination were performed. The population classified three groups according to sport activities. 97th percentile and higher values were accepted as morbid obesity. The blood pressure was measured with a mercury sphygmomanometer with utilizing the proper size cuff in compliance with the criterion used by the “National High Blood Pressure Education Program Working Group”. The complete blood count and biochemistry tests (renal and liver function tests, electrolytes, lipids, hsCRP) of the cases were analysed with biochemistry Roche Cobas Integra 800 and hormon assays of the cases (thyroid function tests, diurnal cortisol, ACTH, 17 OHP, prolactin, DHEA-S) were analysed by ECLIA method on Roche Elecsys 2010 device in the laboratory of our hospital. IR-HOMA values > 2.5 in prepuberal and > 4 in pubertal were defined as the insulin resistance. Bone ages of cases were evaluated with left hand wrist X-ray by using Greulich and Pyle Bone Age Atlas. flow mediated dilation (FMD) was used to assess the endothelial functions of all cases. The brachial artery was evaluated with SPG 12 MHz surface probes by using GE voluson ultrasound system in this method. FMD was expresses as percent (%) increase according to the basal vein dimension. 7% mean value was taken as the limit in the comparisons.
Results: The ratio of male and female was 20/39 in group 1 and 14/31 in group 2. 32.3% of the cases in group 1 and 47.6% of the cases in group 2 were prepubertal. The waist and hip circumferences ratio of the group 1 (0.86 ± 0.05) was significantly higher than group 2 (0.80 ± 0.07). While there was no difference between groups 1 and 2 in terms of the birth weight, using duration period of vitamin D and beginning time to additional nutrition, breastfeeding duration of group 1 (10.6 ± 7.8 months) was significantly shorter than group 2 (14 ± 7.4 months). BMIs of the mothers in group 1 were statistically higher than the mothers in group 2 (27.5 ± 4.8 kg/m² and 24.3 ± 3.2 kg/m² respectively. The mean of IR-HOMA was 4 ± 2.9 in group 1 and 1.9 ± 0.8 in group 2 and there was the insulin resistance in 51% of the obese cases. The dyslipidemia was diagnosed in 38.5% of the cases in group 1. The systolic and diastolic blood pressures in group 1 (117 ± 12.2 mmHg and 73.7 ± 9.4 mmHg respectively) were significantly higher than in group 2 (107.5 ± 9.1 mmHg and 68.2 ± 7.1 mmHg respectively). Hypertension was determined in 25% of the cases included in group 1. The minimum values of FMD in groups 1 and 2 were 1.01% and 3.1% respectively. The maximum values of FMD in groups 1 and 2 were 9.7% and 15% respectively. The mean values of FMD was %5 ± 2.3 in group 1 and %8.1 ± 3.5 in group 2. Compared with group 2, group 1 demonstrated significantly impaired FMD. There was no association between FMD and the birth weight, breastfeeding duration, physical exercises in two groups. A negative correlation was found between FMD and BMI (p < 0.01, r = -0.402). The correlation was determined between FMD and BMI of the mother (p = 0.017, r = -0.305) and the presence of obese individuals in the family (p = 0.021, r =-0.413). It was found that a significant negative correlation between FMD and waist-hip circumference ratio (p = 0.003, r = -0.421). When each groups were assessed in terms of biochemical and hormonal characteristics, there was low negative correlation between FMD and uric acid level and strong negative correlation between FMD and ALT level were determined in group 1.
Conclusion: In our study showed that the obesity begins in the childhood period may cause to the endothelial dysfunction. For this reason, according to our opinion, recognition prior indicators of endothelial dysfunction in early time may be helpful both to take the precautions required and to prevent cardiovascular complications in childhood and influences to the adult period.
The rising sizes of the waist and hip circumferences, positive family history for obesity and obesity of the parents were determined as the most important parameters negative affecting FMD. Unlike the literature, the association between endothelial dysfunction and GGT level the indicator of the hepatosteatosis in obese children was also found as well as FMD and ALT have also a close association independent from BMI in this study. Thus, a different point of view was formed since ALT may possibly have a predictor value in the assessment of the endothelial functions and it is also found as a highlighted risk factors for the endothelial dysfunction in this study. Because of this reason, it can be recommended that when the liver function tests carry out in obese children it does not show only hepatosteatosis but also can be used as an early indicator of the cardiovascular complications of obesity. Another important subject to be emphasize that the ALT level in the childhood period may be an early cardiovascular risk indicator in both obese and nonobese children.
Obesity defined as increased fatty mass is progressively rising in recently, even though its affects begins to all systems in childhood and adolescence periods, the most important morbidity and mortality reason of obesity is its effects on the cardiovascular system. Researches point out endothelial dysfunction and atherosclerosis as the reason of the cardiovascular system disease in obesity. The studies conducted on childhood period related to this subject are highly limited and the results of these are also controversial. Therefore in our study the effects of obesity on endothelial functions in children and adolescents was assessed by flow mediated dilation (FMD) method. In addition to that, effects of epidemiological, biochemical, hormonal and clinical features of cases to FMD were investigated.
One hundred four patients aged between 3 and 18 years who were admitted to the paediatric Endocrinology Department with a complaint of obesity were involved in the study. Patients taking any drugs, endocrinological disorders (such as hypothyroidism, diabetes, Cushing syndrome…), chronic illness, syndromic or monogenic obesity, mental retardation, physiological disorder were excluded in this study. A detailed history of patients was taken, along with anthropometric measurements [height, weight, body mass index (BMI) and percentiles, pubertal staging, bone age], and a physical examination was made. The detailed individual history and epidemiological data (birth weight, nutrition, activity, and parent obesity) were reviewed from the cases. The population classified three groups according to sport activities. The pubertal maturation of the cases were determined according to Tanner-Marshall Pubertal Maturation Stage. The waist and hip circumferences of the cases were measured with a standard nonelastic tape measure. The blood pressure was measured with a mercury sphygmomanometer with utilizing the proper size cuff in compliance with the criterion used by the “National High Blood Pressure Education Program Working Group”.
The body mass indexes were calculated by formula of body weight (kg)/length2 (m). BMI values was evaluated by using the cards prepared for Turkish standards according to the same age and gender. 95th percentile and higher values were accepted as obesity and 97th percentile and higher values were accepted as morbid obesity. Study population consisted of two groups. Obese group (Group 1) was consisted of 59 children. The control group (Group 2) consisted of 45 children Additionally, BMI of children’s parents between 25–29.9 kg/m2 were classified as overweight and 30 kg/m2 and higher values were classified as obese [8]. Bone ages of cases were evaluated with left hand wrist x-ray by using Greulich and Pyle Methods. Biochemical, hormonal parameters [fasting blood glucose and insulin level (FBG, Fin), lipid parameters, thyroid function tests, diurnal cortisol and oral glucose tolerance test (OGTT)] were evaluated. The venous blood samples of the cases were collected at 08:00 – 09:00 in the morning following at least 8 hours of fasting.
The complete blood count and biochemistry tests (renal and liver function tests, electrolytes, lipids, hsCRP) of the cases were analyzed with biochemistry Roche Cobas Integra 800 and hormon assays of the cases (thyroid function tests, diurnal cortisol, ACTH, 17 OHP, prolactin, DHEA-S) were analyzed by ECLIA method on Roche Elecsys 2010 device in the laboratory of our hospital. Oral glucose tolerance test (OGTT) was applied with administrating 1.75 gr/kg (Maximum 75 gr) glucose orally to the obese cases. The fasting blood glucose higher than 100 mg/dl was defined as the impaired fasting glucose and the 2nd hour blood glucose of OGTT higher than 140 mg/dL was defined as the impaired glucose tolerance. Homeostasis model assessment-insulin resistance (HOMA-IR) was defined as [FBG (mg/dL) x fasting blood insulin (IU/L)/405]. IR-HOMA values > 2.5 in prepubertal and >4 in pubertal were defined as the insulin resistance. Blood corti sol levels were obtained at 8:00 a.m. and at midnight during sleep. A morning cortisol level above 20 µg/dL and a midnight cortisol level above 1.8 µg/dL were determined as pathologically. The study protocol was approved by the local ethical committee (Ufuk University, Faculty of Medicine Clinical Research Ethics Committee, number) and written informed consent was obtained from all the patients and their parents.
flow mediated dilation (FMD) method
flow mediated dilation (FMD) was used to assess the endothelial functions of all cases.
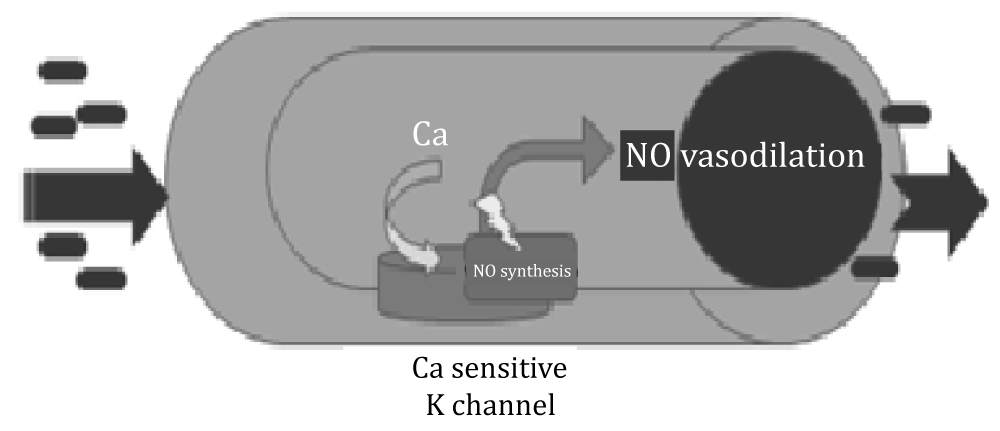
The response capacity of the vascular wall to physical and chemical stimuli means that it can regulate its own tone, regulate blood flow and distribution with environmental changes. Most of the vessels respond to the increase in flow by vasodilation. This event is called AAV. Increasing flow rate of blood in the blood vessels creates a mechanical force (shear stress) on the endothelial cells, increasing the synthesis and release of NO. Non-invasive, ultrasound AAV measurement in the brachial artery is the most widely used method to evaluate endothelial dysfunction in adults and children. Evaluation of endothelium-dependent AAV with high frequency ultrasonographic imaging was developed in the 1990s. This technique is based on provocation of nitric oxide release, which results in vasodilatation, a measurable index of vasomotor function. This technique draws attention because it allows for repeatable measurements and is non-invasive and inexpensive.
FMD was performed in a room with low light, isolated, quiet and 20-25 °C temperature by a same radiologist following a 12-hour fasting period between 08:00 and 10:00. The brachial arteries of the patients were evaluated with the SPG 12 MHz superficial probe using the GE voluson ultrasound system. The brachial artery was visualized 4-8 cm above the antecubital fossa in the longitudinal plane (Figure 1). So that the brachial artery could be viewed from the same point of view throughout the study, the location was marked on the skin. Meanwhile, simultaneous electrocardiogram record was taken and images were recorded digitally and interpreted “off-line”.
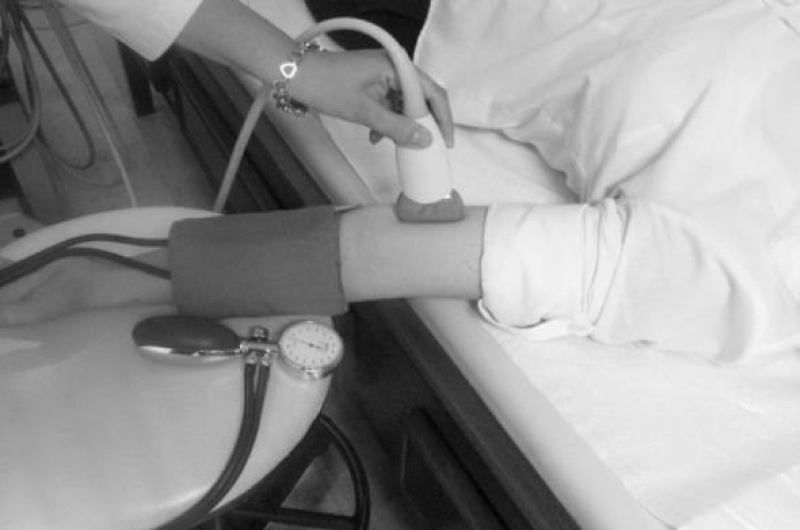
Figure 1: The evaluation of brachial arteries of cases.
The brachial artery diameter (intima to intima) was measured three times and the average of these three measurements was recorded as the basal diameter (Figure 2).
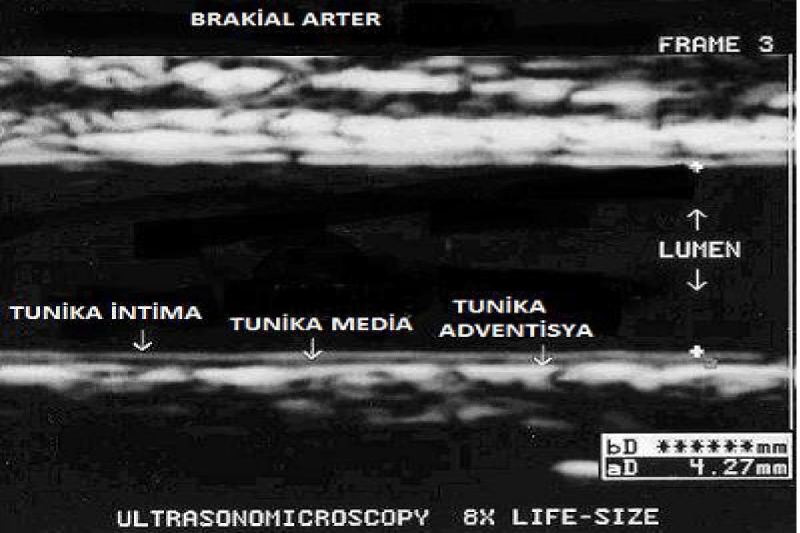
Figure 2: The determination of brachial arter diameter using ECG monitoring system.
These measurements taken from the brachial artery were taken at the end of diastole according to ECG monitoring. Blood flow velocity from the brachial artery region where the diameter was assessed was measured with pulse doppler in peak systole and recorded. After recording the basal brachial artery diameter and flow rate, the cuff of the sphygmomanometer was attached to the arm, then the patient’s blood pressure was measured, and after the measurement, the cuff was inflated above the antecubital fossa with a pressure above the systolic blood pressure (> 50 mmHg) obstruction was provided. After waiting for five minutes in this state, the cuff was lowered. Subsequently, the post-hyperemic vessel diameter was measured at 60 seconds from the region previously marked on the skin. 2D images were taken in the anterior and posterior of the vessel, where the intima could be clearly seen between the lumen and the vessel wall (Figure 3).
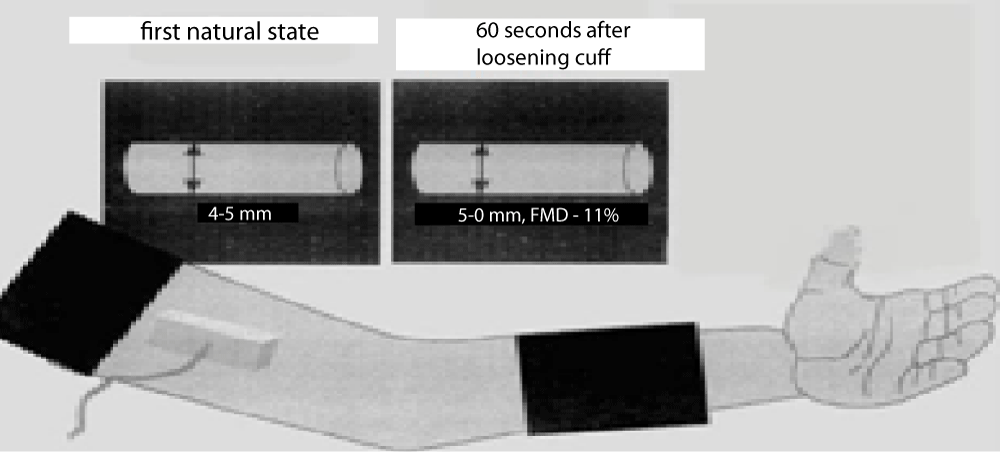
Figure 3: Shematic drawing showing the placement of the sphygmomanometer and receiver.
The brachial artery was evaluated with SPG 12 MHz surface probes by using GE voluson ultrasound system in this method. FMD was expressed as percent (%) increase according to the basal vein dimension. 7% mean value was taken as the limit in the comparisons. The maximum diameter in these measurements was used in AAV calculations. AAV was expressed as percent (%) increase compared to basal vessel diameter. Flow-related vasodilation was calculated with the following equation:
AAV = maximum diameter – basal diameter X 100
(Corretti, et al. Guidelines for Measuring FMD. JACC 2002: 39: 257-65).
Statistical analysis
A commercially available statistical software package (SPSS 21.0 for Windows, Chicago, III. USA) was employed for all statistical analyses. Distributions of the values were analyzed with the Kolmogorov-Smirnov test and values were presented as mean. Comparison of anthropometric measurements, plasma glucose, insulin levels and HOMA-IR levels of the patients with obesity and control patients were made using Student’s t - test, MannWhitney U test. Differences between more than two groups were evaluated with the Kruskal Wallis test. A p - value of less than 0.05 was considered statistically significant.
Anthropometric, biochemical and hormonal parameters of all the cases are given in tables 1-5. The ratio of male and female was 20/39 in group 1 and 14/31 in group 2. 32.3% of the cases in group 1 and 47.6% of the cases in group 2 were prepubertal. The waist and hip circumferences ratio of the group 1 (0.86 ± 0.05) was significantly higher than group 2 (0.80 ± 0.07).
| Table 1: Anthropometric data of all cases (Groups 1,2). | |||
| Parameters | Group 1 | Group 2 | p |
| Age (year) | 12 ± 2,8 | 11,4 ± 2.9 | 0.297 |
| Gender (M/F) | 20/39 | 14/31 | 0,929 |
| Weight (kg) | 65,9 ± 20,5 | 40,9 ± 11,7 | 0,001* |
| Height(cm) | 153,9 ± 12,8 | 147,2 ± 14,3 | 0,014 |
| BMI (kg/m²) | 27,1 ± 5 | 18,4 ± 2,1 | < 0,001* |
| Waist Cırcumference (WC)(cm) | 85,5 ± 12,1 | 64 ± 7,9 | < 0,001* |
| Hip Circumference (HC)(cm) | 98,4 ± 13,3 | 80 ± 9,6 | 0,001* |
| W/H ratio | 0,86 ± 0,05 | 0,80 ± 0,07 | < 0,001* |
| Bone age (year) | 12,6 ± 2,7 | 11,2 ± 2,8 | 0,036* |
| Table 2: Comparison biochemical data between the two groups. | |||
| Group 1 | Group 2 | p | |
| Hb (g/dL) | 13.6 ± 1.1 | 13.6 ± 0.7 | 0.994 |
| Wbc (μL) | 7535 ± 2033 | 6660 ± 1346 | 0,044* |
| Platelet (μL) | 291345 ± 71689 | 275162 ± 56404 | 0,173 |
| CRP (mg/L) | 3,3 ± 3,4 | 1,3 ± 2,2 | < 0,001* |
| Uric acit (mg/dl) | 5,3 ± 1,2 | 4,2 ± 1 | < 0,001* |
| BUN (mg/dL) | 11,4 ± 4,6 | 11,2 ± 6,5 | 0,731 |
| Creatinin (mg/dL) | 0,7 ± 1,5 | 0,5 ± 0,1 | 0,287 |
| Total protein (g/dL) | 7,2 ± 0,5 | 7,3 ± 0,5 | 0,688 |
| Albumin (g/dL) | 4,6 ± 0,3 | 4,8 ± 0,2 | 0,075 |
| Na (mmol/L) | 144,9 ± 3,5 | 145,8 ± 3,4 | 0,288 |
| K (mmol/L) | 4,43 ± 0,3 | 4,5 ± 0,3 | 0,032* |
| Cl (mmol/L) | 104,1 ± 1,9 | 104 ± 2,1 | 0,611 |
| Ca (mg/dL) | 9,9 ± 0,5 | 9,8 ± 0,4 | 0,939 |
| AST (U/L) | 22,6 ± 7,9 | 23,5 ± 7,1 | 0,389 |
| ALT (U/L) | 22,4 ± 11,9 | 20,4 ± 13,5 | 0,154 |
| GGT (U/L | 19,7 ± 9,9 | 10,9 ± 4,8 | < 0,001* |
| ALP (U/L) | 210,6 ± 103,1 | 238,5 ± 72,1 | 0,273 |
| Table 3: Lipid panel data of all cases. | |||
| Group 1 | Group 2 | p | |
| T. colesterol | 168,3 ± 32,9 | 161,4 ± 32,2 | 0,302 |
| LDL | 100,6 ± 29 | 92,2 ± 25,7 | 0,142 |
| HDL | 48,6 ± 11,3 | 56,5 ± 15 | 0,004* |
| Tryglicerid | 104,4 ± 45,6 | 76,4 ± 32,9 | 0,001* |
| VLDL | 21,6 ± 11,5 | 15,6 ± 6,4 | 0,005* |
| Table 4: Comparison of glucose homeostasis parameters between the two groups. | |||
| Grup 1 | Grup 2 | p | |
| FGIR | 7,1 ± 4,9 | 12,9 ± 7,9 | < 0,001* |
| QUICKI | 0,3 ± 0,02 | 0,3 ± 0,03 | < 0,001* |
| Fasting glucose(mg/dL) | 89,8 ± 12,02 | 90,3 ± 5,9 | 0,1607 |
| Fasting insulin (μu/mL) | 17,3 ± 10,5 | 8,6 ± 3,4 | < 0,001* |
| Postprandial insülin (μu/mL) | 74,2 ± 87,4 | 50,6 ± 48,9 | 0,527’ |
| OGTT120 (mg/dL) | 117 ± 52,6 | 113 ± 22,6 | 0,762’ |
| IR- HOMA | 4 ± 2,9 | 1,9 ± 0,8 | < 0,0 |
| Table 5: Comparison of hormonal parameters between the two groups. | |||
| Group 1 | Group 2 | p | |
| TSH (μlu/mL) | 3 ± 1,3 | 2,9 ± 1,3 | 0,932 |
| sT3 (ng/dL) | 0,5 ± 0,4 | 0,5 ± 0,6 | 0,393 |
| sT4 (ng/dL) | 1,3 ± 0,3 | 1,3 ± 0,2 | 0,224 |
| ACTH (pg/ml) | 34,4 ± 24 | 24,9 ± 12,5 | 0,207 |
| 17OHP (ng/ml) | 1,5 ± 0,9 | 1,3 ± 1,3 | 0,179 |
| DHEA-S (μg/dl) | 153,8 ± 106 | 86,7 ± 42,3 | 0,023* |
| Prolactin(ng/mL) | 14,2 ± 9,5 | 10,7 ± 6,5 | 0,134 |
| Cortisol (morning) (μg/dl) | 16 ± 6,8 | 14,6 ± 5,9 | 0,337 |
| Cortisol (evening) (μg/dl) | 2,8 ± 1,9 | 4 ± 3,5 | 0,483 |
| Parathormon (pg/ml) | 60,5 ± 66,9 | 43 ± 24,1 | 1,000 |
The levels of CRP, uric acid and GGT level were higher than group 2 (3.3 ± 3.4 mg/l and 1.3 ± 2.2 mg/l, 5.3 ± 1.2 mg/dl and 4.2 ± 1 mg/dl, 19.7 ± 9.9 U/l and 10.9 ± 4.8 U/l respectively) (Table 2).
The dyslipidemia was diagnosed in 38.5% of the cases in group 1. HDL was significantly low in group 1 than group 2 (48.6 ± 11.3 mg/dl, 56.5 ± 15 mg/dl respectively) and the triglyceride and VLDL rates were significantly high in group 1 than group 2 (104.4 ± 45.6 mg/dL, 76.4 ± 32.9 mg/dL and 21.6 ± 11.5 mg/dL, 15.6 ± 6.4 mg/dL respectively) (Table 3).
The mean of IR-HOMA was 4 ± 2.9 in group 1 and 1.9 ± 0.8 in group 2 and there was the insulin resistance in 51% of the obese cases (Table 4). DHEA-S value was statistically significantly higher in Obese group (Table 5).
While there was no difference between groups 1 and 2 in terms of the birth weight, using duration period of vitamin D and beginning time to additional nutrition, breastfeeding duration of group 1 (10.6 ± 7.8 months) was significantly shorter than group 2 (14 ± 7.4 months). When the epidemiological factors affecting the fat mass are examined breastfeeding time in Obese group was significantly lower than nonObese group (Tables 6,7). The median value at which weight gain started in 59 obese children was 8.45 years (min: 2.5 Max: 13.5).
| Table 6: Comparison epidemiological factors between obese and nonObese groups. | |||
| Obese | Nonobese | ||
| Birth weight (gr) | 3320 ± 546 | 3399 ± 405 | 0,453 |
| Breastfeeding time(mo) | 10,6 ± 7,8 | 14 ± 7,4 | 0,036* |
| VitD prophylaxis(mo) | 6,7 ± 4,1 | 7,8 ± 4 | 0,545 |
| Complemantary feeding time(mo) | 5,3 ± 1,7 | 5,4 ± 1 | 0,564 |
| Table 7: Evaluation of complemantary feeding time time between two groups. | |||
| Groups | ≤ 4 month | > 4 month | p |
| Obese | 28.9 | 71.1 | 0,536 |
| Nonobese | 19.2 | 80.8 | |
In Obese group, the mean BMI of their mothers was significantly higher than nonObese group. BMIs of the mothers in group 1 were statistically higher than the mothers in group 2 27.5 ± 4.8 kg/m² and 24.3 ± 3.2 kg/m² respectively) (Table 8).
| Table 8: Evaluation of parental BMIs between groups. | |||
| Groups | Obese | Nonobese | p |
| Maternal BMI Paternal BMI |
27.5 ± 4.8 29.2 ± 3.8 |
24.3 ± 3.2 27.4 ± 3.8 |
0.004 0,085 |
The otherhand it is observed that the presence of obese people in their first-degree relatives and distant relatives is significantly higher in the family of the Obese group (Table 9).
| Table 9: Frequency of obesity in relatives of obese and nonObese groups. | ||||
| Relatıves | ||||
| No | First degree | Distant | p | |
| Obese | 51.7% | 22.4% | 25.9% | < 0,001 |
| Nonobese | 95.3% | 2.3% | 2.3% | |
Considering the frequency of exercise it was observed that 49% of obese patients only do their daily activities. In addition only 9.1% of obese patients had regular sports activities. There was a significant difference in frequency of exercise between the two groups (Table 10). When the diet of nonobese and obese cases was questioned, it was seen that 42.9% of obese children fed more frequently than 3 main and 2 snacks. There was a significant difference between feeding patterns (Table 11).
| Table 10: Comparison of exercise frequency in obese and nonObese groups. | ||||
| Activity(%) | Daily | Normal | High | p |
| Obese | 49.1 | 41.8 | 9.1 | 0,001 |
| Nonobese | 10.2 | 66.7 | 23.1 | |
| Table 11: The relationship between the number of meals of the groups. | |||
| Number of meals | Obese | Nonobese | p |
| > 3+2 | 7.1 | 20.5 | 0,001 |
| 3+2 | 50 | 71.8 | |
| 3+2 < | 42.9 | 7.7 | |
The systolic and diastolic blood pressures in Obese group were significantly higher than in nonObese group. Hypertension was determined in 25% of the cases (n = 15) included in group 1 (Table 12) (Figure 4).
| Table 12: Systolic and diastolic blood pressures of the groups. | |||
| Blood Pressure(mmHg) | Group 1 | Group 2 | p |
| Systolic | 117 ± 12,2 | 107,5 ± 9,1 | 0,001* |
| Diastolic | 73,7 ± 9,4 | 68,2 ± 7,1 | 0,006* |
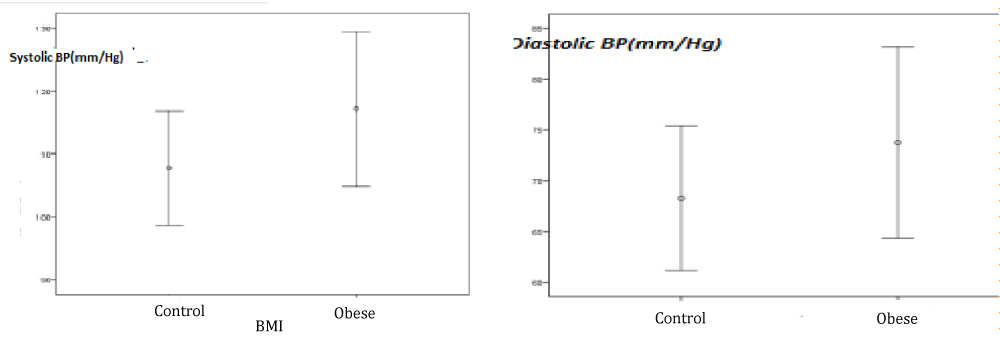
Figure 4: Systolic and diastolic blood pressures in obese and control groups.
Examination of flow-mediated dilation (FMD) and affecting parameters
The difference between the mean flow-mediated dilation (FMD) values between the two groups was significant. Minimum values of FMD in groups 1 and 2 were 1.01% and 3.1% respectively. The maximum values of FMD in groups 1 and 2 were 9.7% and 15% respectively. The mean values of FMD was %5 ± 2.3 in group 1 and %8.1 ± 3.5 in group 2 (Table 13).
| Table 13: FMD values of the groups. | |||
| FMD | Group 1 | Group 2 | p |
| Mean | 5 ± 2,3 | 8,1 ± 3,5 | < 0,001* |
| Min/Max | 1.01/9.7 | 3.1/15 | |
FMD value was found below 7% in 76.8% of the Obese group. Compared with group 2, group 1 demonstrated significantly impaired FMD (Table 14).
| Table 14: Evaluation of FMD value with 7% limit. | |||
| FMD | < %7 | ≥ %7 | p |
| Group 1 | 76.8% | 23.2% | < 0,001* |
| Group 2 | 48.9% | 51.1% | |
FMD has negative correlation with BMI (p < 0.01 and r = -0.402) (Figure 5).
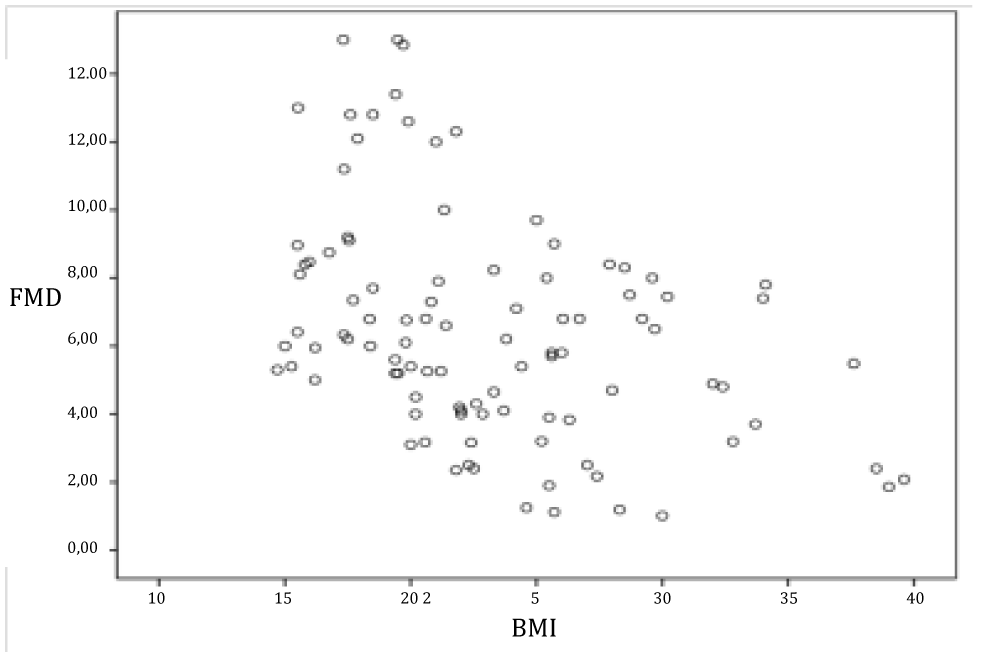
Figure 5: Evaluation of the relationship between FMD and BMI.
There was no significant correlation between FMD and epidemiological characteristics. There was no association between FMD and the birth weight (Group 1: 0,91; Group 2: 0,169) breastfeeding duration (Table 15), physical exercises in two groups.
| Table 15: The relationship between breastfeeding time and FMD. | |||||||
| Breastfeeding time | > 6 | 6-12 | 13-18 | > 18 | mean | p | |
| Group 1 | % | 5,1 | 4,6 | 4,6 | 5,3 | 4,8 | 0,906 |
| Group 2 | % | 4,8 | 7,2 | 9,4 | 9,2 | 8,1 | 0,163 |
The correlation was determined between FMD and BMI of the mother (p = 0.017, r = -0.305) and the presence of obese individuals in the family (p = 0.021, r = -0.413). When FMD was examined according to obesity onset age, it was observed that there was no significant difference (Table 16) (Figure 6).
| Table 16: Evaluation of FMD according to obesity onset age begining obesity. | |||
| FMD | < %7 | ≥%7 | p |
| ≤11 | 80,6% | 19.4% | |
| >11 | 75% | 25% | |
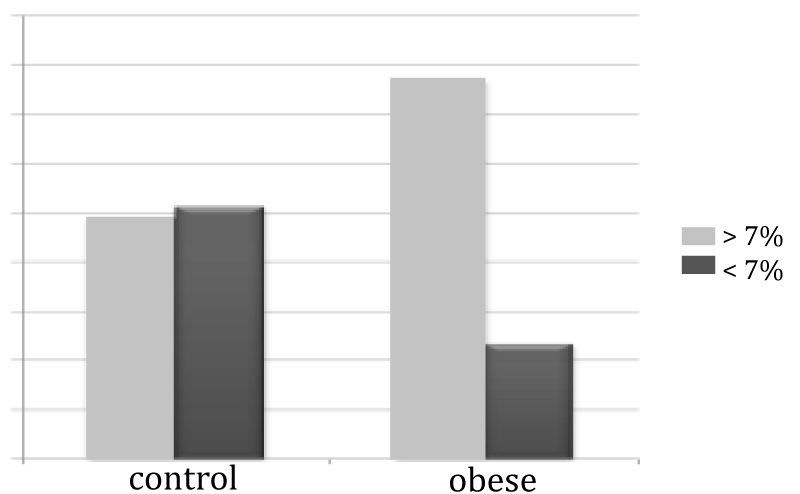
Figure 6: Evaluation of FMD value with 7% limit.
When evaluated separately with Kruskal-Wallis Test for both groups, there was no difference between breastfeeding time and FMD in obese and normal groups (Table 17) (Figure 7).
| Table 17: Comparison of the effetes of biochemical and hormonal parameters on FMD between groups. | ||||
| Group 1 | Group 2 | |||
| r | p | r | p | |
| Hb | -0,139 | 0,321 | -0,162 | 0,298 |
| WBC | -0,031 | 0,823 | 0,279 | 0,070 |
| Platelet | 0,218 | 0,121 | 0,123 | 0,433 |
| Crp | -0,209 | 0,173 | 0,088 | 0,610 |
| FG | -0,029 | 0,833 | -0,100 | 0,531 |
| FI | -0,085 | 0,542 | -0,067 | 0,683 |
| PI | -0,042 | 0,837 | -0,309 | 0,691 |
| OGTT120 | -0,166 | 0,372 | -- | - |
| IR- HOMA | 0,081 | 0,593 | -0,184 | 0,368 |
| FG/FIratio | 0,085 | 0,541 | 0,127 | 0,434 |
| QUICK İndeksi | 0,082 | 0,554 | 0,085 | 0,601 |
| HbA1c | -0,580 | 0,305 | - | - |
| Total cholesterol | 0,135 | 0,339 | 0,173 | 0,275 |
| VLDL | 0,042 | 0,777 | -0,009 | 0,958 |
| LDL | 0,085 | 0,547 | 0,105 | 0,504 |
| HDL | 0,165 | 0,243 | 0,195 | 0,222 |
| TG | -0,014 | 0,922 | -0,82 | 0,615 |
| ACTH | -0,142 | 0,417 | -0,368 | 0,239 |
| DHEA-S | -0,138 | 0,384 | -0,157 | 0,473 |
| Prolactin | -0,193 | 0,297 | -0,330 | 0,213 |
| PTH | -0,112 | 0,888 | - | - |
| 17 0HP | -0,023 | 0,889 | 0,250 | 0,261 |
| BUN | 0,000 | 0,998 | -0,121 | 0,458 |
| Creatinin | -0,052 | 0,721 | -0,231 | 0,147 |
| Üric Ascit | -0,289* | 0,049* | -0,104 | 0,533 |
| Na | 0,066 | 0,679 | -0,075 | 0,690 |
| K | -0,052 | 0,740 | 0,171 | 0,350 |
| Cl | 0,023 | 0,895 | -0,121 | 0,547 |
| Ca | 0,314* | 0,045* | 00,017 | 0,927 |
| AST | -0,303* | 0,030* | 0,002 | 0,988 |
| ALT | -0,348* | 0,012* | -0,011 | 0,945 |
| GGT | -0,351* | 0,025* | -0,184 | 0,390 |
| ALP | -0,094 | 0,595 | 0,062 | 0,759 |
| Total Protein | 0,272 | 0,188 | 0,375 | 0,153 |
| Albumin | 0,283 | 0,144 | -0,169 | 0,477 |
| TSH | -0,020 | 0,888 | 0,002 | 0,992 |
| ST3 | 0,165 | 0,257 | -0,006 | 0,972 |
| ST4 | 0,210 | 0,135 | 0,012 | 0,938 |
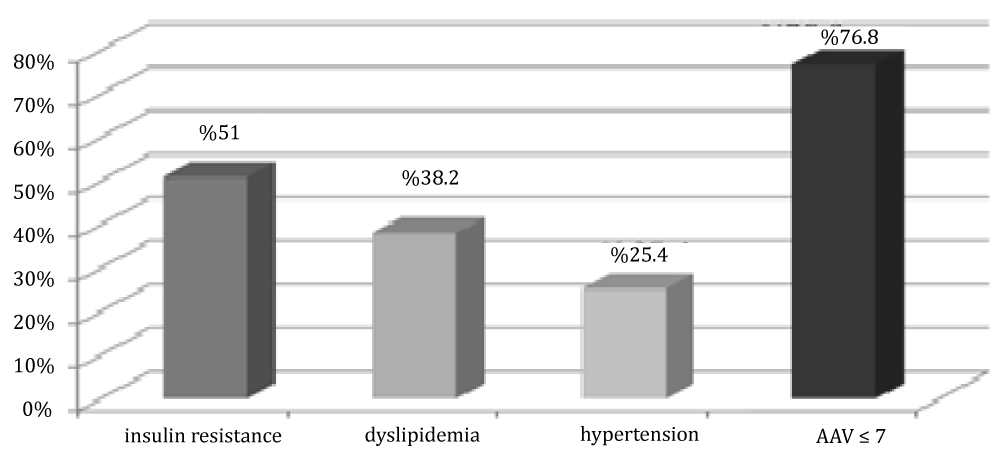
Figure 7: Distribution of cases in group 1 by insulin resistance, dyslipidemia and FMD value.
It was found that a significant negative correlation between FMD and waist-hip circumference ratio (p = 0.003, r = -0.421).
FMD was evaluated by correlation analysis in terms of biochemical and hormonal properties between the two groups. In Group 1, there was a negative correlation between AAV and uric acid, AST, ALT, GGT levels (p = 0.049, p = 0.0012, p = 0.003, p = 0.025, respectively) and a positive correlation (p = 0.045) with Ca level. When each groups were assessed in terms of biochemical and hormonal characteristics, there was low negative correlation between FMD and uric acid level and strong negative correlation between FMD and ALT level were determined in group 1.
In group 1, 51% of patients had insulin resistance, 38.5% of them had dyslipidemia, and 25% of patients had hypertension.
Evaluation of glucose metabolism parameters with FMD; It was our 9.9-year-old patient with a low FMD value of 1.01% and impaired glucose tolerance. While the mean age of 4 cases with FMD value below 1.8% was 10.8 ± 0.8, the mean FMD value of these cases was found to be 1.14 ± 0.1%.
It is revealed by studies that childhood obesity causes more mortality and morbidity compared to obesity that started in adulthood. As stated in the Bogalusa heart study, the risk of atherosclerosis increases with increasing obesity time [1]. Arterial endothelial dysfunction is early in the atherosclerotic process and develops due to impairment in the production and release of endothelial nitric oxide (NO). NO is not only a vasodilating agent, but also inhibits monocyte adhesion, vascular smooth muscle cell proliferation and platelet activation [2]. Many invasive and non-invasive methods have been developed recently to evaluate endothelial functions. Although it is non-invasive in determining endothelial dysfunction, flow-mediated vasodilation method (FMD) is frequently preferred because it gives similar results with invasive methods and it is easy to apply. Although there is no consensus regarding the normal values of FMD, the FMD value was found to be 8.1 ± 3.5% in the group that we took as healthy for our study. In restricted publications, FMD value varies between 7% - 10% in healthy individuals. Carvisalo, et al. in 2002, they found AAV as 7.7 ± 4% in 105 healthy children [3]. In the studies conducted in China in 2005, FMD values were evaluated as 18.8 ± 7.7% in healthy children [4]. In a study that took place in Hong Kong China in 2015 the mean FMD in children aged 14 years was reported to be 8.77 ±0.89% in males, 8.70 ± 0.91% in females. In this study although the mean FMD was approximately 8%, it increased with age and was distinct between males and females, indicating age- and sex-specific endothelial function [5]. When the 10-year literature review of 16,680 cases in which brachial artery AAVs were performed was reviewed, it was determined that AAV ranged from 0.2% to 19.2% in the healthy population [6]. The presence of Kawasaki disease [7], HIV infection [8], homozygous homocystinuria [9], any systemic inflammation that increases CRP, chronic kidney failure before and after renal transplantation [10,11], increased lipid levels of type1 DM patients [6,12], HbA1c high, that is, poor glycemic control has been reported to affect AAV negatively [13]. Although there are studies related to endothelial functions in obese patients, the results in childhood evaluations are still controversial. Therefore, in our study it is aimed to help explain the epidemiological and clinical situation in obese children. In our study, it was found that AAV was statistically significantly lower as a result of comparison between obese cases and normal weight group. In a study of obese French children, impairment of endothelial functions was shown with FMD [14]. In a study conducted in Brazil comparing the laboratory and sonographic findings of endothelial dysfunction in obese and nonobese children, significantly lower values of FMD were observed in the Obese group [15]. Although there is strong evidence of the effect of obesity on the vascular endothelium at an early age, the underlying mechanisms that can cause are still controversial.
Many studies have been done to explain these mechanisms and relationships between different parameters and FMD have been revealed. In our study, besides anthropometric properties, some biochemical and hormonal values were also compared. In a study, a correlation was found between the degree of endothelial dysfunction and BMI [16]. In our study, we found a negative correlation between FMD and BMI in line with the literature. At the same time, we evaluated the waist/zip ratio, which was found to be more specific than BMI by some sources in the evaluation of obesity, firstly its relation with the Obese group and then its correlation with FMD. In our study, the ratio of waist to hip circumference, which is also the criterion of metabolic syndrome, was found to be significantly different in our Obese group. In particular, this difference was observed to be caused by the measurement between obese and healthy girls. The other hand, it was seen that there was a significant negative correlation between waist hip ratio and FMD in single correlations and partial correlations.
In our study while there was a difference between systolic and diastolic blood pressure in normal and Obese groups in girls, only in systolic blood pressure in obese and normal groups was observed in boys. There was a positive correlation between BMI excess and high blood pressure (p < 0.05). In a study conducted in 2006, the difference of systolic blood pressure is more pronounced than diastolic [17]. In our study, we also examined the relationship between obese patients and AAV values with birth weight and breast milk. Martin, et al. showed a decreased response to acetylcholine in 9-year-old children with a low birth weight history [18]. Leeson, et al. reported that low birth weight may be associated with endothelial dysfunction later in life [19]. In the study conducted in children between the ages of 7-15, endothelial dysfunction was detected in non-obese cases with a history of SGA, and absence of endothelial dysfunction in patients with obese but no SGA history showed the role of SGA in endothelial dysfunction [20]. All of the cases in our study had a history of term and AGA, and it was seen that there was no significant difference when we looked at the relationship between birth weight and FMD.
In a prospective study in children, breast milk was shown to be protective against obesity, and in our study, a negative relationship was found between breastfeeding time and obesity. The positive effects of breast milk on microvascular functions in children aged 11-14 years were investigated, and it was suggested that the risk of cardiovascular disease in 159 children may decrease with breast milk in infants [21]. WHO’s global strategy on infant and early childhood nutrition (Geneva 2003) recommends breastfeeding for more than 6 months. On the other hand, it was reported in a study that long-term breastfeeding may impair arterial functions in the early adulthood [22]. However, in our study, although the use of breast milk was significantly less in obese cases, the difference between the duration of breastfeeding and the normal and Obese group of AAV and the groups according to the breastfeeding status were also not significant. This may be due to the low number of cases or other accompanying risk factors.
Although the mechanisms thought to enhance the endothelial functions of breast milk are still not fully known, it is known that long-chain polyansatted fatty acids are not found in ordinary formulas when found in breast milk and they use these fatty acids to provide structural and functional integrity such as prostoglandin synthesis. Infants using formulas enriched by these fatty acids have been found to have a positive effect on 6-year-old blood pressure measurements [23]. In addition, eicosopentaenoic acid and docosaxaenoic acid added to the diet of normal adults have been shown to potentiate acetylcholine-dependent vasodilation [24].
Estimating the effects of daily activity and nutrition on obesity. Although there is no relationship between exercise and FMD in our study, there are articles supporting this. It was thought that this may be due to the low number of patients and subjective evaluation of exercise.
In our study, it was observed that children in the Obese group fed more meals than in the healthy group. There was no correlation between the frequency of feeding and FMD in the relationship of this diet with FMD. In our study, the age at which the average weight gain began was found to be 7.94 and the median of 8.45 years. In 80.6% of the group where obesity started before the age of 11, FMD was < 7%, while in 75% of those who started after the age of 11, FMD was < 7%. However, this difference between them was not statistically significant. However, these data may suggest that obesity that starts at an early age impairs vascular function more.
The relationship between parent and child in obesity in childhood has been revealed through various studies. It is also supported by some studies that maternal obesity is important in determining the child’s weight [25,26]. When the weight of the parents is examined in our study, it is seen that maternal obesity is significant in determining the child’s weight. Similarly, it was found that the family history of obesity and FMD were also correlated. In addition, when a history of obesity was questioned in first and second degree relatives, 5% of the families of normal weight children had obesity, while 48% of obese children had a history of obesity. The biochemical parameters of the children in our study were evaluated between the groups and their effects on FMD. When serum lipid parameters, one of the important cardiovascular risk factors in obese children, are evaluated, Gutin, et al. reported a strong correlation between the increase in body fat rate and serum triglyceride and TK / HDL-C ratio in children aged 7-11 [27]. Wattigney reported that there was a positive relationship between obesity and serum TK, TG, VLDL, and LDL levels and a negative relationship with HDL in children [28]. In our study, in accordance with the literature, there was a significant decrease in HDL in obese patients and a significant increase in TG. Most obese patients have metabolic syndrome. insulin resistance, which forms the basis of the metabolic syndrome, is considered as the common point of obesity and vascular function [16]. It is thought that in case of insulin resistance, oxidative stress increase, insulin vasodilator effect and impairment of NO synthesis and impairment of the hormone vascular effects as a result of impaired insulin signaling pathway [29]. In addition to insulin resistance, mediators such as TNF-α and IL-6 released by adipose tissue contribute to endothelial dysfunction [30]. Steinberg, et al. have shown that in severe obese (BMI > 34) and insulin resistance and normal glucose tolerance, blood flow and vascular reactivity, endothelial function as well as DM [31]. More than half of the obese patients in our study had insulin resistance. In addition, it has been found that insulin resistance has a stronger damaging effect on endothelial functions than hyperglycemia in our obese cases. In our study, 3 (8.5%) of 35 cases with morbidly obese were impaired glucose tolerance and 3 (8.5%) of obese cases, 2 of which were the same case, had impaired fasting glucose. Although there was no significant relationship between FMD and glucose metabolism, the case with the lowest FMD value was our 9.9-year-old patient with impaired glucose tolerance. In some studies showed that, the effect of obesity and insulin resistance on endothelial functions is much stronger than hyperglycemia. Plasma ICAM and ET-1 levels were higher in patients with impaired glucose tolerance [31,32].
Increased serum CRP and IL6 are important indicators in the determination of proinflumatory status in obese children with liver fat. The source of most of the circulating CRP is IL-6 [33]. Through the IL-6 portal vein it reaches the liver directly from the visceral adipose tissue. Recent in vitro studies show that IL-6 is an important pathogenic mechanism in endothelial dysfunction. In our study, hs-CRP mean values were 1.288 + 2.22 mg / L for the normal group and 3.34 + 3.408 mg / L for the Obese group. Hs-CRP mean values were above normal limits in the Obese group and a significant difference was found between the two groups.
Another molecule that is thought to cause endothelial dysfunction and is determined by studies is uric acid [34]. In rats experiments, uricase inhibitor has been given and hyperuricemia has been shown to decrease NO production in animals that cause hyperuricemia leading to endothelial dysfunction [35]. In a study, an increase in FMD was observed at the end of treatment given to hyperuricemic patients with low FMD for 3 months after allopurinol treatment [36].
The main conclusion of our study is, obesity-related endothelial dysfunction also arises in childhood. The rising sizes of the waist and hip circumferences, positive family history for obesity and obesity of the parents were determined as the most important parameters negative affecting FMD. Unlike the literature, the association between endothelial dysfunction and GGT level the indicator of the hepatosteatosis in obese children was also found as well as FMD and ALT have also a close association independent from BMI in this study. Thus, a different point of view was formed since ALT may possibly have a predictor value in the assessment of the endothelial functions and it is also found as a highlighted risk factors for the endothelial dysfunction in this study. Because of this reason, it can be recommended that when the liver function tests carry out in obese children it does not show only hepatosteatosis but also can be used as an early indicator of the cardiovascular complications of obesity. Another important subject to be emphasize that the ALT level in the childhood period may be an early cardiovascular risk indicator in both obese and nonobese children.
In summary, our study showed that the obesity begins in the childhood period may cause to the endothelial dysfunction. For this reason, according to our opinion, recognition prior indicators of endothelial dysfunction in early time may be helpful both to take the precautions required and to prevent cardiovascular complications in childhood and influences to the adult period.
- Freedman DS, Dietz WH, Tang R, Mensah GA, Bond MG, et al. The relation of obesity throughout life to carotid intima-media thickness in adulthood: the Bogalusa Heart Study. Int J Obes Relat Metab Disord. 2004; 28: 159-166. PubMed: https://pubmed.ncbi.nlm.nih.gov/14581934/
- Skilton MR, Celermajer DS. Endothelial dysfunction and arterial abnormalities in childhood obesity. Int J Obes. 2006; 30: 1041-1049. PubMed: https://pubmed.ncbi.nlm.nih.gov/16801941/
- Ja¨rvisalo MJ, Ro¨nnemaa T, Volanen I, Kaitosaari T, Kallio K, et al. Brachial artery dilatation responses in healthy children and adolescents. Am J Physiol Heart Circ Physiol. 2002; 282: 87–92. PubMed: https://pubmed.ncbi.nlm.nih.gov/11748051/
- Zhu W, Huang X, Li M, Neubauer N. Arterial intima-media thickening and endothelial dysfunction in obese Chinese children. Eur J Pediatr. 2005; 164: 337–344. PubMed: https://pubmed.ncbi.nlm.nih.gov/15750804/
- Li AM, Celermajer DS, Chan MH, Sung RY, Woo KS. Reference range for brachial artery flow-mediated dilation in healthy Chinese children and adolescents. Hong Kong Med J. 2018; 24: 36-38. PubMed: https://pubmed.ncbi.nlm.nih.gov/29937445/
- Bots M, Westerink J, Rabelink TJ, de Koning KJP. Assessment of flow-mediated vasodilatation (FMD) of the brachial artery: Effects of technical aspects of the FMD measurement on the FMD response. Eur Heart J. 2005; 26: 363–368. PubMed: https://pubmed.ncbi.nlm.nih.gov/15618057/
- Deng YB, Li TL, Xiang HJ, Chang Q, Li CL. Impaired endothelial function in the brachial artery after Kawasaki disease and the effects of intravenous administration of vitamin C. Pediatr Infect Dis J. 2003; 22: 34–39. PubMed: https://pubmed.ncbi.nlm.nih.gov/12544406/
- Bonnet D, Aggoun Y, Szezepanski I, Bellal N, Blanche S. Arterial stiffness and endothelial dysfunction in HIV-infected children. AIDS. 2004; 18: 1037–1041. PubMed: https://pubmed.ncbi.nlm.nih.gov/15096807/
- Woo KS, Chook P, Chan WB, So WY, Cockram CS, Celermajer DS. Type 1 diabetes and arterial dysfunction in asymptomatic Chinese adults. Diabetes Care. 2001; 24: 173. PubMed: https://pubmed.ncbi.nlm.nih.gov/11194226/
- Kari JA, Donald AE, Vallance DT, Bruckdorfer KR. Physiology and biochemistry of endothelial function in children with chronic renal failure. Kidney Int. 1997; 52: 468–472.
- Lilien MR, Stroes ES, Op’t Roodt J, de Jongh S, Schro¨der CH, et al. Vascular function in children after renal transplantation. Am J Kidney Dis. 2003; 41: 684–691.
- Donaghue KC, Robinson J, McCredie R, Fung A, Silink M, et al. Large vessel dysfunction in diabetic adolescents and its relationship to small vessel complications. J Pediatr Endocrinol Metab. 1997; 10: 593–598. PubMed: https://pubmed.ncbi.nlm.nih.gov/9467129/
- Donaghue KC, Robinson J, McCredie R, Fung A, Silink M, et al. Macroangiopathy: does it play a role in young people? Horm Res. 1998; 50: 38–40. PubMed: https://pubmed.ncbi.nlm.nih.gov/9676996/
- Tounian P, Aggoun Y, Dubern B, et al. Presence of increased stiffness of the common carotid artery and endothelial dysfunction in severely obese children: a prospective study. Lancet. 2001; 358: 1400–1404. PubMed: https://pubmed.ncbi.nlm.nih.gov/11705484/
- Costa KCM, Ciampo LAD, Silva PS, Lima JC, Martins WP, Nogueira de Almeida CA. Ultrasonographic markers of cardiovascular disease risk in obese children. Rev Paul Pediatr. 2018; 36: 171-175. PubMed: https://pubmed.ncbi.nlm.nih.gov/29617475/
- Singhal A. Endothelial dysfunction: role in obesity-related disorders and the early origins of CVD. Proc Nutr Soc. 2005; 64: 15-22. PubMed: https://pubmed.ncbi.nlm.nih.gov/15877918/
- Franco MCP, Christofalo D, Sawaya A, Varille V, Guy-Grand B, et al. Effects of Low Birth Weight in 8- to 13-Year-Old Children: Implications in Endothelial Function and Uric Acid Levels. Hypertension. 2006; 48: 45-50. PubMed: https://pubmed.ncbi.nlm.nih.gov/16682609/
- Martin H, Hu J, Gennser G, Norman M. Impaired endothelial function and increased carotid stiffness in 9-year-old children with low birthweight. Circulation. 2000; 102: 2739–2744. PubMed: https://pubmed.ncbi.nlm.nih.gov/11094041/
- Leeson CP, Whincup PH, Cook DG, Donald AE, Papacosta O, et al. Flow-mediated dilation in 9- to 11-year-old children: the influence of intrauterine and childhood factors. Circulation. 1997; 96: 2233–2238. PubMed: https://pubmed.ncbi.nlm.nih.gov/9337195/
- Shirley DG, Walter SJ. Acute and chronic changes in renal function following unilateral nephrectomy. Kidney Int. 1991; 40: 62–68. PubMed: https://pubmed.ncbi.nlm.nih.gov/1921156/
- Khan F, Green FC, Forsyth JS, Greene SA, Newton DJ, et al. The beneficial effects of breastfeeding on microvascular function in 11- to 14-year-old children. Vasc Med. 2009; 14: 137-142. PubMed: https://pubmed.ncbi.nlm.nih.gov/19366820/
- Leeson CPM, Kattenhorn M, Deanfield JE, Lucas A. Duration of breast feeding and arterial distensibility in early adult life: population based study. Br Med J. 2001; 322: 643–647. PubMed: https://pubmed.ncbi.nlm.nih.gov/11250848/
- Forsyth JS, Willatts P, Agostoni C, Bissenden J, Casaer P, et al. Long chain polyunsaturated fatty acid supplementation in infant formula and blood pressure in later childhood: follow up of a randomised controlled trial. Br Med J. 2003; 326: 953–957. PubMed: https://pubmed.ncbi.nlm.nih.gov/12727766/
- Khan F, Elherik K, Bolton-Smith C, Barr R, Hill A, et al. The effects of dietary fatty acid supplementation on endothelial function and vascular tone in healthy subjects. Cardiovasc Res. 2003; 59: 955–962. PubMed: https://pubmed.ncbi.nlm.nih.gov/14553835/
- Garn SM, Sullivan TV, Hawthorne VM. Fatness and obesity of the parents of obese individuals. Am J Clin Nutr. 1989; 50: 1308-1313. PubMed: https://pubmed.ncbi.nlm.nih.gov/2596422/
- De Jongh S, Lilien MR, Bakker HD, Hutten BA, Kastelein JJ, et al. Family history of cardiovascular events and endothelial dysfunction in children with familial hypercholesterolemia. Atherosclerosis. 2002; 163: 193–197. PubMed: https://pubmed.ncbi.nlm.nih.gov/12048139/
- Gutin B, Islam S, Manos T, Cucuzzo N, Smith C, et al. Relation of percentage of body fat and maximal aerobic copacity to risk factors for atherosclerosis an diabetes in black and white seven-to eleven-year-old children. J Pediatrics.1994; 125: 847-852. PubMed: https://pubmed.ncbi.nlm.nih.gov/7996354/
- Wattigney W, Harsha DW, Srinivasan SR, Webber LS, Berenson GS. Increasing impact of obesity on serum lipids and lipoproteins in young adults. The Bogalusa Heart study. Arch Intern Med. 1991; 151: 2017-2022. PubMed: https://pubmed.ncbi.nlm.nih.gov/1929690/
- Cusi K, Maezono K, Osman A, Pendergrass M, Patti ME, et al. Insulin resistance differentially effects the PI3 kinase and MAPkinase-mediated signaling in human muscle. J Clin Invest. 2000; 105: 311-320. PubMed: https://pubmed.ncbi.nlm.nih.gov/10675357/
- Falcão-Pires I, Castro-Chaves P, Miranda-Silva D, Lourenço AP, Leite-Moreira AF. Physiological, pathological and potential therapeutic roles of adipokines. Drug Discov Today. 2012: 17: 880-899. PubMed: https://pubmed.ncbi.nlm.nih.gov/22561894/
- Steinberg HO, Chaker H, Leaming R, Johnson A, Brechtel G, et al. Obesity/insulin resistance is associated with endothelial dysfunction. J Clin Invest. 1996; 97: 2601–2610. PubMed: https://pubmed.ncbi.nlm.nih.gov/8647954/
- Chen NG, Homes M, Reaven GM. Relationship between insulin resistance, soluble adhesion molecules, and mononuclear cell binding in healthy volunteers. J Clin Endocrinol Metab. 1999; 84: 3485–3489. PubMed: https://pubmed.ncbi.nlm.nih.gov/10522984/
- Heinrich PC, Castell JV, Andus T. Interleukin-6 and the acute phase response. Biochem J. 1990; 265: 621–636. PubMed: https://pubmed.ncbi.nlm.nih.gov/1689567/
- Puddu P, Puddu GM, Cravero E, Vizioli L, Muscari A. The relationships among hyperuricemia, endothelial dysfunction, and cardiovascular diseases: molecular mechanisms and clinical implications. J Cardiol. 2012; 59: 235-242. PubMed: https://pubmed.ncbi.nlm.nih.gov/22398104/
- Khosla UM, Zharikov S, Finch JL, Nakagawa T, Roncal C, et al. Hyperuricemia induces endothelial dysfunction. Kidney Int. 2005; 67: 1739-1742. PubMed: https://pubmed.ncbi.nlm.nih.gov/15840020/
- Mercuro G, Vitale C, Cerquetani E, Zoncu S, Deidda M, et al. Effect of hyperuricemia upon endothelial function in patients at increased cardiovascular risk. Am J Cardiol. 2004; 94: 932–935. PubMed: https://pubmed.ncbi.nlm.nih.gov/15464681/