
More Information
Submitted: 11 May 2020 | Approved: 20 May 2020 | Published: 21 May 2020
How to cite this article: Munir S, Riaz S, Arshad T, Riaz A. Risk Factors Associated to Patients with Type 2 Diabetes in Lahore District. Ann Clin Endocrinol Metabol. 2020; 4: 011-019.
DOI: 10.29328/journal.acem.1001014
ORCiD: orcid.org/0000-0001-8836-0710
Copyright License: © 2020 Munir S, et al. This is an open access article distributed under the Creative Commons Attribution License, which permits unrestricted use, distribution, and reproduction in any medium, provided the original work is properly cited.
Keywords: Major risk factors; Meta-analysis; Convenient sampling; Associations; Industrial area
Abbreviations: Pops: Persistent Organic Pollutants; Pcdds: Polychlorinated Dibenzo-P-Dioxins; Pcdfs: Polychlorinated Dibenzofurans; HRGC: High Resolution Gas Chromatography; HRMS: High Resolution Mass Spectrometry; PREDIMED: The Prevención Con Dietamediterránea; ADA: American Diabetes Association; T2DM: Type 2 Diabetes Mellitus

Risk Factors Associated to Patients with Type 2 Diabetes in Lahore District
Snobia Munir*, Samreen Riaz, Tooba Arshad and Aasma Riaz
Department of Microbiology and Molecular Genetics, Quaid-e-Azam Campus, University of the Punjab, Lahore, Pakistan
*Address for Correspondence: Snobia Munir, Department of Microbiology and Molecular Genetics, Quaid-e-Azam Campus, University of the Punjab, Lahore, Pakistan, Tel: 03158269694; Email: [email protected]
Our research aimed to check the impact of some significant risk variables on diabetes growth and the specific goal of this study was to evaluate the connection of industrial fields with diabetes risk variables. The current research also informs us about the most important risk factor for male and female people with diabetes. A cross-section and convenient sample of 100 people, male and female, without discernment of risk factors and diabetes mellitus (Meta-Analysis on the effect of major risk factors on the diabetic patients form Jinnah Hospital Lahore). The risk factors in the general assessment i.e. lack of exercise, kidney problems, high ranges of tests and residence in industrial areas are found to be significant. Assessment of these factors is helpful in early diagnosis and in prognosis of diabetes.
Diabetes mellitus is a wide occurring ailment. Globally more than 400 million individuals have diabetes, and if present studies prevail, the incidence is expected to increase. Diabetes is a significant cause of early death, heart attack, and stroke. In 2016, it is the seventh major cause of death [1]. Pakistan with a diabetic population of 5.2 million, 90% of which are Type 2 was ranked 6th in 2000 in a World Health Organization (WHO) list of nations with the largest amount of diabetics [2]. Diabetes is due to either the pancreas not producing enough insulin or the cells of the body not responding properly to the insulin produced [3,11,12]. Worldwide, individuals with diabetes were roughly “171 million (2.8 percent of the world’s population)” in the year 2000, and anticipated 366 million individuals will be from developing regions of the world from this figure [4]. Recent studies demonstrate that “environmental chemicals” are a significant cause and contributor to increased diabetes proportion [4]. One of the main causes of diabetes and long-lasting health conditions is fatness and heavy weight. Diabetes occurs mostly in developing nations between 40-60 years of age and mostly in developed areas over 60 years of age [4].
Sometimes, studies of individuals exposed to elevated concentrations of environmental variables (dioxin, POPs, PCDDs) (TCDD) discovered enhanced rates of type 2 diabetes. Other studies also discovered that diabetes is associated with exposure to environmental variables (dioxin, POPs, PCDDs) in Vietnam (e.g., [5,6] and in veterans exposed to Agent Orange in Korea [7].
Environmental factors (dioxin, POPs, PCDDs)s are mainly by-products of industrial processes but can also result from natural processes, such as volcanic eruptions and forest fires. Environmental factors (dioxin, POPs, PCDDs) are unwanted by-products of a wide range of manufacturing processes including smelting, chlorine bleaching of paper pulp and the manufacturing of some herbicides and pesticides. Uncontrolled waste incinerators (solid waste and hospital waste) are often the worst culprits for releasing environmental variables (dioxin, POPs, PCDDs) owing to incomplete burning. Technology is accessible that enables the controlled incineration of waste with low environmental emissions (dioxin, POPs, PCDDs).
While environmental factors (dioxin, POPs, PCDDs) are formed locally, the distribution of the environment is global. Environmental factors (dioxin, POPs, PCDDs) are discovered in the setting around the globe. Some soils, sediments and foods, particularly dairy products, meat, fish and shellfish, have the largest concentrations of these compounds. In crops, water and air, very small concentrations are discovered.
Motivating background
The first motivation was from the findings of Chin-Chi, et al. [8] conducted a study to evaluate the epidemiologic and experimental evidence on the relationship of environmental chemicals with obesity, diabetes and metabolic syndrome. They identified a total of 29 articles (7 on arsenic, 3 on cadmium, 2 on mercury, 11 on persistent organic pollutants, 3 on phthalates and 4 on bisphenol A) including 7 prospective studies. Considering consistency, temporality, strength, dose-response, and biological plausibility (confounding), they concluded that the evidence is suggestive but not sufficient for a relationship between arsenic and persistent organic pollutants, and insufficient for mercury, phthalates and bisphenol A. For cadmium the epidemiologic evidence does not seem to suggest an association with diabetes.
A second motivation stems from the findings of Fernández [9]. Performed a study to evaluate the iron excess and risk of type 2 diabetes mellitus in a prospective cohort of Mediterranean population. He conducted three studies on the PREDIMED cohort with data collected in men and women aged 55 to 80 from centers located in Reus-Tarragona, Pamplona and/or Barcelona. A conditional logistic regression model was fitted and adjusted for socio-demographic, anthropometric, lifestyle, dietary and inflammation variables. The methodology included the diagnosis of T2DM based on ADA criteria. These results obtained were that in an adult Mediterranean population at high cardiovascular risk, high dietary iron and body iron stores increase the risk of T2DM after adjustment for potential confounding variables.
Thirdly work of Kanan and Samara, [10] gave us motivation who conducted a study that encompasses the historical presence of PCDDs and PCDFs in the world-wide environment. Information on exposure indicated that the main route of exposure of dioxins/furans to humans is through ingestion, which is discussed in this paper. The extraction methods including USEPA 8290 are the most used with HRGC/HRMS preferred as a detection tool. Moreover, a detailed compilation of studies of the PCDD concentrations and environmental sources from major industrial regions in several countries are presented. In summary, the major sources of dioxins in the worldwide environment include combustion and industrial sources with major challenges related to the lack of data availability in the Middle East especially with the current Warfare conflicts in the region.
Selection of patients
Over 100 Type 2 diabetic patients were included in the study. All other patients having disease other than diabetes were excluded.
Ethical approval of the study
Ethical approval for the study was taken from the Ethical/Protocol/Synopsis Committee of Jinnah Hospital, Lahore. Pakistan.
Target population
The target population of the present study comprised of all the diabetic patients of the Jinnah Hospital, Lahore.
Sampling
A convenient sampling was used to collect data. 100 patients were included in the study.
Survey method
The success of the survey depends upon the accuracy of data collection. The collection of accurate data depends upon the correct choice of survey method. For current study a questionnaire and face to face interview was used to collect data.
Data collection
For this particular study the face to face interviews were conducted along with the questionnaire. Data was collected within a month. By keeping in mind the difficulty of understanding and language among senior (old) patients and those who came from rural areas. So it was the best way to ask questions from the patients and fill the questionnaire on our own.
Field experience
There came some difficulties in field experience. The respondents’ behavior was very good but some of them refused to answer the questions. After explaining the objectives of the study they agreed to co-operate with the interview. Some respondents praised our research topic and some even gave us their contact numbers to inform them the result of our study but it was a good experience on the whole.
Questionnaire
The questionnaire contained a total of 54 questions. First 7 questions were used to collect personal information of the patients, the remaining questions access the factors affecting diabetic patients.
Analysis
Data was analyzed by using multiple tests including tests for associations Pearson’s chi-squared test (χ2), the goodness-of-fit test and Mann-Whitney U test.
The study comprises 100 diabetic patients including male and female. Approximately 22 risk factors like age, gender. marital status, profession, performance of exercise, taking proper meals, usage of fast food, eating away from home, usage of tobacco, usage of alcohol and heavy drinkers, usage of cigarettes. cigar, pipe and chew, availability of blood sugar meter, recording sugar levels, usage of medications, living in industrial areas, satisfaction with the sanitation system, usage of processed meat, usage of additives in food like sugar tablets were recorded (Figure 1).
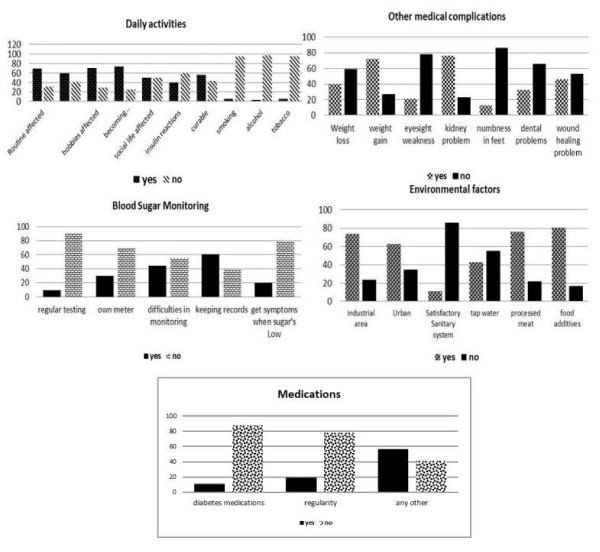
Figure 1: Graphical representation of different variables against different factors.
Some of these variables, including age, are regarded as quantitative. All other factors are qualitative, most of which are in dichotomous form (yes/no). This portion of the research is split into two sections in order to present the full and thorough analysis; descriptive and analytical section.
Descriptive analysis
In this section the frequency and percentages of the different environmental factors of diabetes for patients will be discussed. There are 100 subjects (diabetic patients). The debate of the results will base on the frequency (counts), percentages (Table 1).
| Table 1: Descriptive Statistics (Demographic Variables). | |||||||
| Frequencies (percentages) of demographic questions: | |||||||
| Variable | Classification | Patients’ Gender | Total Count % | ||||
| Male | Female | ||||||
| Count | % | Count | % | ||||
| 1. Age | 20-35 | 5 | 35.7 | 9 | 64.3 | 14 | 100 |
| 36-50 | 16 | 41.0 | 23 | 59.0 | 39 | 100 | |
| 51-65 | 10 | 28.6 | 25 | 71.4 | 35 | 100 | |
| 66-80 | 5 | 41.7 | 7 | 58.3 | 12 | 100 | |
| 2. Marital status | Single | 2 | 50.0 | 2 | 50.0 | 4 | 100 |
| Married | 34 | 35.4 | 62 | 64.6 | 96 | 100 | |
| 3. Family strength | 1-6 | 19 | 38.8 | 30 | 61.2 | 49 | 100 |
| 7-12 | 16 | 33.3 | 32 | 66.7 | 48 | 100 | |
| 13-18 | 1 | 33.3 | 2 | 66.7 | 3 | 100 | |
| 4. Patients in family | 0-3 | 34 | 41.0 | 49 | 59.0 | 83 | 100 |
| 4-8 | 1 | 7.7 | 12 | 92.3 | 13 | 100 | |
| 9-12 | 1 | 25.0 | 3 | 75.0 | 4 | 100 | |
| 5. Profession | House wife | 0 | 0.0 | 55 | 100.0 | 55 | 100 |
| Office Job | 16 | 72.7 | 6 | 27.3 | 22 | 100 | |
| Others | 20 | 87.0 | 3 | 13.0 | 23 | 100 | |
Inferential analysis
In Table we are testing the association of all the major risk factors with people living in industrial areas. Here from this table we can see that the type of exercise, kidney problems, range of tests and kind of industry are significantly associated with whether patients live in an industrial area or not. It can be seen that age, profession and satisfaction with sanitary system is significantly associated with marital status while all the other risk factors showed no association with marital status (Table 2).
| Table 2: Other variables. | |||||||
| Variable | Classification | Patients’ Gender | Total | ||||
| Male | Female | Count | % | ||||
| Count | % | Count | % | ||||
| follow regular ` | No | 11 | 36.7 | 19 | 63.3 | 30 | 30.0 |
| Yes | 25 | 35.7 | 45 | 64.3 | 70 | 70.0 | |
| type of exercise | None | 10 | 37.0 | 17 | 63.0 | 27 | 27.0 |
| Walk | 26 | 36.6 | 45 | 63.4 | 71 | 71.0 | |
| other | 0 | 0.0 | 2 | 100 | 2 | 2.0 | |
| days per week you exercise | none | 10 | 37.0 | 17 | 63.0 | 27 | 27.0 |
| daily | 24 | 38.1 | 39 | 61.9 | 63 | 63.0 | |
| after 1 day | 0 | 0.0 | 4 | 100.0 | 4 | 4.0 | |
| after 2 days | 2 | 33.3 | 4 | 66.7 | 6 | 6.0 | |
| each session | none | 10 | 37.0 | 17 | 63.0 | 27 | 27.0 |
| 15 min | 6 | 21.4 | 22 | 78.6 | 28 | 28.0 | |
| 30 min | 8 | 30.8 | 18 | 69.2 | 26 | 26.0 | |
| 1 hour | 12 | 63.2 | 7 | 63.0 | 19 | 19.0 | |
| time of day you exercise | none | 10 | 37.0 | 17 | 63.0 | 27 | 27.0 |
| morning | 22 | 40.7 | 32 | 59.3 | 54 | 54.0 | |
| afternoon | 1 | 10.0 | 9 | 90.0 | 10 | 10.0 | |
| evening | 3 | 33.3 | 6 | 66.7 | 9 | 9.0 | |
| avoid any specific exercise | Yes | 0 | 0.0 | 3 | 100.0 | 3 | 3.0 |
| No | 36 | 37.1 | 61 | 62.9 | 97 | 97.0 | |
| health interfered with hobbies | No | 15 | 51.7 | 14 | 48.3 | 29 | 29.0 |
| Yes | 21 | 29.6 | 50 | 70.4 | 71 | 71.0 | |
| diabetes making more emotional | No | 10 | 38.5 | 16 | 61.5 | 26 | 26.0 |
| Yes | 26 | 35.1 | 48 | 64.9 | 74 | 74.0 | |
| diabetes affecting routine life | No | 16 | 51.6 | 15 | 48.4 | 31 | 31.0 |
| Yes | 20 | 29.0 | 49 | 71.0 | 69 | 69.0 | |
| health interfered with household chores | No | 21 | 51.2 | 20 | 48.8 | 41 | 41.0 |
| Yes | 15 | 25.4 | 44 | 74.6 | 59 | 59.0 | |
| diabetes affecting social life | No | 21 | 42.0 | 29 | 58.0 | 50 | 50.0 |
| Yes | 15 | 30.0 | 35 | 70.0 | 50 | 50.0 | |
| feel any change after taking insulin | No | 28 | 46.7 | 32 | 53.3 | 60 | 60.0 |
| Yes | 8 | 20.0 | 32 | 80.0 | 40 | 40.0 | |
| diabetes is curable | No | 9 | 20.5 | 35 | 79.5 | 44 | 44.0 |
| Yes | 27 | 48.2 | 29 | 51.8 | 56 | 56.0 | |
| smoking | Yes | 5 | 100 | 0 | 0.0 | 5 | 5.0 |
| No | 31 | 32.6 | 64 | 67.4 | 95 | 95.0 | drinking alcohol | weekly | 1 | 100 | 0 | 0.0 | 1 | 1.0 |
| monthly | 1 | 50.0 | 1 | 50.0 | 2 | 2.0 | |
| never | 34 | 35.1 | 63 | 64.9 | 97 | 97.0 | |
| using tobacco | No | 33 | 34.7 | 62 | 65.3 | 95 | 95.0 |
| cigarette | 2 | 100 | 0 | 0.0 | 2 | 2.0 | |
| any other | 1 | 33.3 | 2 | 66.7 | 3 | 3.0 | |
| Since when. | 0-5 years | 31 | 33.0 | 63 | 67.0 | 94 | 94.0 |
| 6-40 years | 5 | 83.3 | 1 | 16.7 | 6 | 6.0 | |
| meals usually eaten per day | 2 times | 12 | 35.3 | 22 | 64.7 | 34 | 34.0 |
| 3 times | 24 | 38.7 | 38 | 61.3 | 62 | 62.0 | |
| 4 times | 0 | 0.0 | 4 | 100.0 | 4 | 4.0 | |
| Snacks taken per day? | One time | 11 | 26.8 | 30 | 73.2 | 41 | 41.0 |
| two time | 21 | 46.7 | 24 | 53.3 | 45 | 45.0 | |
| never | 4 | 28.6 | 10 | 71.4 | 14 | 14.0 | |
| no. of times a week eaten away from home | Once per week | 13 | 52.0 | 12 | 48.0 | 25 | 25.0 |
| Twice in week | 3 | 50.0 | 3 | 50.0 | 6 | 6.0 | |
| never | 20 | 29.0 | 49 | 71.0 | 69 | 69.0 | |
| meals usually eaten away from home | junk food | 1 | 6.3 | 15 | 93.8 | 16 | 16.0 |
| Chinese | 3 | 100 | 0 | 0.0 | 3 | 3.0 | |
| Desi | 32 | 39.5 | 49 | 60.5 | 81 | 81.0 | |
| skipping meals | Yes | 12 | 34.3 | 23 | 65.7 | 35 | 35.0 |
| No | 24 | 36.9 | 41 | 63.1 | 65 | 65.0 | |
| weight loss after diabetes | Yes | 12 | 30.0 | 28 | 70.0 | 40 | 40.0 |
| No | 24 | 40.0 | 36 | 60.0 | 60 | 60.0 | |
| Weight gain after diabetes? | Yes | 29 | 40.3 | 43 | 59.7 | 72 | 72.0 |
| No | 7 | 25.0 | 21 | 75.0 | 28 | 28.0 | |
| weak eyesight | Yes | 10 | 47.6 | 11 | 52.4 | 21 | 21.0 |
| No | 26 | 32.9 | 53 | 67.1 | 79 | 79.0 | |
| kidney problem | Yes | 32 | 42.1 | 44 | 57.9 | 76 | 76.0 |
| No | 4 | 16.7 | 20 | 83.3 | 24 | 24.0 | |
| numbness/tingling/loss of feeling in your feet | Yes | 5 | 38.5 | 8 | 61.5 | 13 | 13.0 |
| No | 31 | 35.6 | 56 | 64.4 | 87 | 87.0 | |
| dental problem | Yes | 18 | 54.5 | 15 | 45.5 | 33 | 33.0 |
| No | 18 | 26.9 | 49 | 73.1 | 67 | 67.1 | |
| wound healing problem | Yes | 17 | 37.0 | 29 | 63.0 | 46 | 46.0 |
| No | 19 | 35.2 | 35 | 64.8 | 54 | 54.0 | |
| testing of blood sugar | Yes | 3 | 33.3 | 6 | 66.7 | 9 | 9.0 |
| No | 33 | 36.3 | 58 | 63.7 | 91 | 91.0 | |
| owning blood sugar meter | Yes | 14 | 46.7 | 16 | 53.3 | 30 | 30.0 |
| No | 22 | 31.4 | 48 | 68.6 | 70 | 70.0 | |
| Difficulties in monitoring blood sugar | Yes | 15 | 34.1 | 29 | 65.9 | 44 | 44.0 |
| No | 21 | 37.5 | 35 | 62.5 | 56 | 56.0 | |
| usual range of tests | 0-200 | 11 | 34.4 | 21 | 65.6 | 32 | 32.0 |
| 201-400 | 18 | 40.0 | 27 | 60.0 | 45 | 45.0 | |
| 410-600 | 6 | 35.3 | 11 | 64.7 | 17 | 17.0 | |
| recording results | Yes | 26 | 42.6 | 35 | 57.4 | 61 | 61.0 |
| No | 10 | 26.3 | 28 | 73.7 | 38 | 38.0 | |
| getting signs or symptoms when blood sugar is low | Yes | 8 | 40.0 | 12 | 60.0 | 20 | 20.0 |
| No | 28 | 35.4 | 51 | 64.6 | 79 | 79.0 | |
| taking diabetes medications | Yes | 5 | 45.5 | 6 | 54.5 | 11 | 11.0 |
| No | 31 | 35.2 | 57 | 64.8 | 88 | 88.0 | |
| kind of medicine | none | 5 | 45.5 | 6 | 54.5 | 11 | 11.0 |
| Diabetes Pills | 16 | 35.6 | 29 | 64.4 | 45 | 45.0 | |
| Insulin Injections | 8 | 34.8 | 15 | 65.2 | 23 | 23.0 | |
| Combination | 7 | 35.0 | 13 | 65.0 | 20 | 20.0 | |
| regular in taking medicine | Yes | 10 | 52.6 | 9 | 47.4 | 19 | 19.0 |
| No | 26 | 32.5 | 54 | 67.5 | 80 | 80.0 | |
| Taking any other medications. | Yes | 24 | 42.1 | 33 | 57.9 | 57 | 57.0 |
| No | 12 | 29.3 | 29 | 70.7 | 41 | 41.0 | |
| meeting doctor | Weekly | .9 | 47.4 | 10 | 52.6 | 19 | 19.0 |
| Monthly | 20 | 35.7 | 36 | 64.3 | 56 | 56.0 | |
| Once a year | 7 | 30.4 | 16 | 69.6 | 23 | 23.0 | |
| living in an industrial area | Yes | 30 | 40.5 | 44 | 59.5 | 74 | 74.0 |
| No | 6 | 25.0 | 18 | 75.0 | 24 | 24.0 | |
| kind of industry near | Eatables | 2 | 25.0 | 6 | 75.0 | 8 | 8.0 |
| garments | 3 | 50.0 | 3 | 50.0 | 6 | 6.0 | |
| others | 0 | 0.0 | 9 | 100.0 | 9 | 9.0 | |
| none | 31 | 40.3 | 46 | 59.7 | 77 | 77.0 | |
| living place | Rural Area | 16 | 45.7 | 19 | 54.3 | 35 | 35.0 |
| Urban Area | 20 | 31.7 | 43 | 68.3 | 63 | 63.0 | |
| sanitary system is satisfactory | Yes | 5 | 41.7 | 7 | 58.3 | 12 | 12.0 |
| No | 31 | 36.0 | 55 | 64.0 | 86 | 86.0 | |
| kind of water drunk | tap water | 20 | 45.5 | 23 | 53.5 | 43 | 43.0 |
| filter water | 16 | 29.1 | 39 | 70.9 | 55 | 55.0 | |
| usage of processed meat | Yes | 29 | 37.7 | 48 | 62.3 | 77 | 77.0 |
| no | 7 | 33.3 | 14 | 66.7 | 21 | 21.0 | |
| usage of food additives | yes | 28 | 34.6 | 53 | 65.4 | 81 | 81.0 |
| no | 8 | 47.1 | 9 | 52.9 | 17 | 17.0 | |
Testing of patient’s gender with the factors
We have applied Mann-Whitney U test to find the effect of gender on major risk factors that are physical activities, daily activities, meals, other complications, blood sugar monitoring, medications and environmental factors. There was effect of patients’ gender regarding other complications involved in diabetes while there is no effect of gender on physical activities of patients, daily activities of patients, meals taken by patients, blood sugar monitoring, proper medications and environmental factors. It is observed that patients who came from rural areas have a poor environmental exposure and medications are not properly available there whereas patients coming from urban areas have good environmental exposure and can take proper medications.
The primary goal of the research was to identify effect of environmental factors on diabetes patients. To attain this task a time based study had been carried out in the city of Lahore and the data has been collected from The Diabetic Centre, Jinnah hospital Lahore. A sample of 100 patients has been obtained. These patients were considered to be the respondents’ once diagnosed by the doctor to be having diabetes. Duration of study was fixed and convenient sampling method was used. The data was gathered through questionnaire and interview.
In Hypothesis Testing following results have been found
Here we have seen that the type of exercise, kidney problems, range of tests and kind of industry are significantly associated with whether patients live in an industrial area or not. It was observed that people coming from areas having industries nearby were having certain complications like kidney problems. We conclude that industrial areas have waste discharges; this waste gets in drains and canals and thus becomes a reason for water pollution and other pollutions too. Drinking water of these areas can cause many problems i.e. kidney problems, diarrhea, nausea etc. This results in the increased range of blood sugar tests of the patients since patients already ill will have less energy and hence their power will be less too. This depends upon the kind of industry that is in their locality.
The variables that are insignificantly associated with industrial area such as weight loss, weight gain, eyesight, numbness in feet, dental problem etc. indicate that proper medications were used by patients which gave considerably better results even when they were exposed i.e. living in industrial areas.
It can be seen that age, profession and satisfaction with sanitary system is significantly associated with marital status. Most of the females were housewives and married whereas only a few were working and single. Only 12 patients said they were satisfied with sanitary system in their area while others were not satisfied.
There was effect of patients’ gender regarding other complications involved in diabetes whereas medications and environmental factors were affected by the habitat of patients.
There were seven variables. Results from our study suggested that patients’ gender had effect on this factor (other complications). It can be said that the complications such as weight loss, weight gain, eyesight, kidney problems, dental problems, numbness/tingling/loss of feeling in feet, wound healing problems were effected by gender of patients (Figure 1). Male patients suffered from fewer complications as compared to female patients because males were active, most of them were working i.e. laborers, farmers, job holders while most of females were housewives, who were less active as compared to men and hence faced more complications.
The habitat of patients meant whether they lived in rural or urban areas. The risk factor medication was effected by habitat of patients. Patients who lived in urban areas could conveniently buy authorized medicines, which gave better results. There was availability of medical stores and pharmacies in city area whereas patients coming from a rural area faced many problems. The availability of medical stores and pharmacies was not easy for patients living in rural areas. These medical stores and pharmacies were very distant and secondly the medicines available there at those medical stores and pharmacies, situated in rural areas, were not authorized i.e. Insulin was not authorized and hence proper health results could not be seen. This created the effect of habitat on the medications.
The environmental factors include variables that are industrial areas, kind of industries, sanitary system, water, use of processed meat and food additives. There was effect of habitat (urban/rural) on these variables.
The aim of this research was to study the effects of certain major risk factors on the development of diabetes and the specific objectives were to assess the associations of gender of patients with the risk factors of diabetes. After selecting the topic, introduction and literature review of problem was collected from different sources including journals, articles books and electronic media. The questionnaire consisted of the bio-data of persons and following risk factors of (1)physical activities, (2)daily activities, (3)meals, (4)other complications, (4)blood sugar monitoring, (5)medications and (6)environmental factors as demonstrated in figure 1 and table 2. A cross-section and convenient sampling of 100 persons was conducted consisting of both males and females without any discrimination.
After the information was collected, it was selected for statistical analysis according to pre-coded criteria. The specified information was then entered into a private computer compatible with IBM. The study was conducted using software S.P.S.S. version 23.0 (Social Science Statistical Package) based on descriptive and analytical bases. In descriptive assessment, frequency distribution, percentages and cross tabs were calculated to verify the connection between distinct information characteristics and, in inferential assessment, chi-square tests were used to verify the importance of distinct factors by relating this statistics with P-value, normality tests were applied to check whether data is normal or not and Mann-Whitney U test was applied to check the effect of different risk factors on the variables.
The results of this cross sectional study provided information regarding the risk factors of Diabetes in Lahore, Pakistan. It is observed that the females (64) were more than males (36) as shown in table 1. The reason for large number of females then males may be the population (Hospital) from which the data was collected therefore ratio of female person was greater than males. In the overall analysis the risk factors i.e. type of exercise, kidney problems, range of tests and kind of industry are significantly associated with marital status. Age, profession and satisfaction with sanitary system are significantly associated with marital status.
There was effect of patients’ gender regarding other complications involved in diabetes whereas medications and environmental factors were affected by the habitat of patients (Table 3a-e).
| Table 3a: Association of Patients living in industrial area with major risk factors. | ||||
| Statements | Chi square | d.f | p-value | Conclusion |
| Ho: There is no association of industrial area and Family Patients. | 1.468 | 2 | 0.480 | Insignificant |
| Ho: There is no association of industrial area and regular exercise | 0.322 | 1 | 0.571 | Insignificant |
| Ho: There is no association of industrial area and type of exercise | 6.296 | 2 | 0.043* | Significant |
| Ho: There is no association of industrial area and days per week you exercise | 1.812 | 3 | 0.612 | Insignificant |
| Ho: There is no association of industrial area and length of each session | 0.690 | 3 | 0.876 | Insignificant |
| Ho: There is no association of industrial area and when you usually exercise | 5.958 | 3 | 0.114 | Insignificant |
| Ho: There is no association of industrial area and avoid any specific exercise | 0.131 | 1 | 0.718 | Insignificant |
| Ho: There is no association of industrial area and health interfered hobbies or activities | 0.353 | 1 | 0.552 | Insignificant |
| Ho: There is no association of industrial area and making more emotional | 0.755 | 1 | 0.385 | Insignificant |
| Ho: There is no association of industrial area and affected routine life | 0.031 | 1 | 0.860 | Insignificant |
| Ho: There is no association of industrial area and health affected household chores | 0.870 | 1 | 0.351 | Insignificant |
| Ho: There is no association of industrial area and affected social life | 0.883 | 1 | 0.347 | Insignificant |
| Ho: There is no association of industrial area and change after taking insulin injections | 2.345 | 1 | 0.126 | Insignificant |
| Ho: There is no association of industrial area and Its curable disease | 1.660 | 1 | 0.198 | Insignificant |
| Ho: There is no association of industrial area and smoking | 1.709 | 1 | 0.191 | Insignificant |
| Ho: There is no association of industrial area and drink alcohol | 1.004 | 2 | 0.605 | Insignificant |
| Ho: There is no association of industrial area and usage of tobacco | 3.570 | 2 | 0.168 | Insignificant |
| Ho: There is no association of industrial area and Since when smoking. | 0.270 | 1 | 0.603 | Insignificant |
| Ho: There is no association of industrial area and meals usually eaten per day | 5.808 | 2 | 0.055 | Insignificant |
| Ho: There is no association of industrial area and snacks taken per day | 0.209 | 2 | 0.901 | Insignificant |
| Ho: There is no association of industrial area and times a week do you eat out | 1.433 | 2 | 0.489 | Insignificant |
| Ho: There is no association of industrial area and meals eaten away from home | 1.004 | 2 | 0.605 | Insignificant |
| Ho: There is no association of industrial area and skip meals | 1.318 | 1 | 0.251 | Insignificant |
| Ho: There is no association of industrial area and weight loss | 0.145 | 1 | 0.704 | Insignificant |
| Ho: There is no association of industrial area and weight gain | 0.104 | 1 | 0.748 | Insignificant |
| Ho: There is no association of industrial area and eyesight weakness | 0.007 | 1 | 0.935 | Insignificant |
| Ho: There is no association of industrial area and kidney problem | 5.860 | 1 | 0.015* | Significant |
| Ho: There is no association of industrial area and numbness/tingling/loss of feeling in your feet | 0.672 | 1 | 0.412 | Insignificant |
| Ho: There is no association of industrial area and dental problem | 0.208 | 1 | 0.648 | Insignificant |
| Ho: There is no association of industrial area and wound healing problem | 0.000 | 1 | 0.992 | Insignificant |
| Ho: There is no association of industrial area and testing blood sugar | 0.419 | 1 | 0.517 | Insignificant |
| Ho: There is no association of industrial area and own a blood sugar meter | 2.910 | 1 | 0.088 | Insignificant |
| Ho: There is no association of industrial area and difficulties monitoring your blood sugar | 0.063 | 1 | 0.802 | Insignificant |
| Ho: There is no association of industrial area and Usual range of tests. | 6.641 | 2 | 0.036* | Significant |
| Ho: There is no association of industrial area and record blood sugars | 0.022 | 1 | 0.883 | Insignificant |
| Ho: There is no association of industrial area and getting signs or symptoms when your blood sugar is low | 0.274 | 1 | 0.601 | Insignificant |
| Ho: There is no association of industrial area and taking diabetes medications | 0.267 | 1 | 0.606 | Insignificant |
| Ho: There is no association of industrial area and kind of medicine taken | 6.490 | 3 | 0.090 | Insignificant |
| Ho: There is no association of industrial area and regular in taking medicine | 0.151 | 1 | 0.698 | Insignificant |
| Ho: There is no association of industrial area and any other medications | 0.209 | 1 | 0.648 | Insignificant |
| Ho: There is no association of industrial area and meeting doctor | 0.832 | 2 | 0.660 | Insignificant |
| Ho: There is no association of industrial area and kind of industry | 72.887 | 3 | 0.000* | Significant |
| Ho: There is no association of industrial area and habitat | 0.078 | 1 | 0.779 | Insignificant |
| Ho: There is no association of industrial area and sanitary system | 0.002 | 1 | 0.965 | Insignificant |
| Ho: There is no association of industrial area and kind of water drunk | 0.063 | 1 | 0.802 | Insignificant |
| Ho: There is no association of industrial area and Usage of processed meat | 0.007 | 1 | 0.935 | Insignificant |
| Ho: There is no association of industrial area and Usage of food additives | 3.097 | 1 | 0.078 | Insignificant |
| Table 3b: Association of Marital Status with all other variables. | |||
| Statements | Chi square | d.f. | p-value |
| Ho: There is no association of marital status and age. | 82.639 | 37 | .000* |
| Ho: There is no association of marital status and gender | .354 | 1 | .552 |
| Ho: There is no association of marital status and family strength | 7.676 | 13 | .864 |
| Ho: There is no association of marital status and family Patients | 5.042 | 8 | .753 |
| Ho: There is no association of marital status and profession | 60.937 | 35 | .004* |
| Ho: There is no association of marital status and if you follow a regular exercise program or routine. | .050 | 1 | .824 |
| Ho: There is no association of marital status and type of exercise done. | 1.702 | 2 | .427 |
| Ho: There is no association of marital status and no. of days per week exercise was done | 2.447 | 3 | .485 |
| Ho: There is no association of marital status and how long at each session of exercise was | 2.140 | 3 | .544 |
| Ho: There is no association of marital status and the time of day do you usually exercise | 3.223 | 3 | .358 |
| Ho: There is no association of marital status and has your physician told you to avoid any specific exercise | .575 | 2 | .750 |
| Ho: There is no association of marital status and is your health interfered with your hobbies or recreational activities? | .032 | 1 | .857 |
| Ho: There is no association of marital status and do you think diabetes makes you more emotional? | .002 | 1 | .963 |
| Ho: There is no association of marital status and has diabetes affected your routine life. | .070 | 1 | .791 |
| Ho: There is no association of marital status and if health was interfered with household chores. | .140 | 1 | .709 |
| Ho: There is no association of marital status and if diabetes affected your social life. | 1.042 | 1 | .307 |
| Ho: There is no association of marital status and if you feel any change in your body after taking insulin injections. | .203 | 2 | .903 |
| Ho: There is no association of marital status and if you think diabetes is curable disease. | .610 | 1 | .435 |
| Ho: There is no association of marital status and if you smoke. | 3.509 | 1 | .061 |
| Ho: There is no association of marital status and if you drink alcohol. | .129 | 2 | .938 |
| Ho: There is no association of marital status and if you use tobacco. | .219 | 2 | .896 |
| Ho: There is no association of marital status and since how long ago you are using tobacco. | .266 | 5 | .998 |
| Ho: There is no association of marital status and no. of meals do you usually eat per day. | .530 | 3 | .912 |
| Ho: There is no association of marital status and no.of times you take snacks per day. | 1.266 | 3 | .737 |
| Ho: There is no association of marital status and no. of times a week do you eat away from home. | 3.701 | 3 | .296 |
| Ho: There is no association of marital status and meals that are usually eaten away from home. | .380 | 3 | .944 |
| Ho: There is no association of marital status and if you ever skip meals. | .530 | 3 | .912 |
| Ho: There is no association of marital status and if you feel any weight loss after diabetes. | .159 | 1 | .690 |
| Ho: There is no association of marital status and if you feel any weight gain after diabetes. | .011 | 1 | .917 |
| Ho: There is no association of marital status and if your eyesight become weak after diabetes. | .036 | 1 | .850 |
| Ho: There is no association of marital status and if you have any kidney problem after diabetes. | .007 | 1 | .932 |
| Ho: There is no association of marital status and if you have any numbness/tingling/loss of feeling in your feet. | .547 | 2 | .761 |
| Ho: There is no association of marital status and if you have any dental problem after diabetes. | 3.263 | 2 | .196 |
| Ho: There is no association of marital status and if you have any wound healing problem after diabetes. | 1.374 | 2 | .503 |
| Ho: There is no association of marital status and if you test your blood sugar. | .417 | 1 | .519 |
| Ho: There is no association of marital status and if you have your own blood sugar meter. | .766 | 1 | .382 |
| Ho: There is no association of marital status and if you had any difficulties monitoring your blood sugar. | .087 | 2 | .958 |
| Ho: There is no association of marital status and Usual range of tests. | 100.000 | 84 | .112 |
| Ho: There is no association of marital status and record blood sugars. | .238 | 1 | .626 |
| Ho: There is no association of marital status and getting signs or symptoms when your blood sugar is low. | 1.055 | 1 | .304 |
| Ho: There is no association of marital status and taking diabetes medications. | .814 | 1 | .367 |
| Ho: There is no association of marital status and kind of medicine taken. | 1.986 | 3 | .575 |
| Ho: There is no association of marital status and regular in taking medicine. | 2.484 | 2 | .289 |
| Ho: There is no association of marital status and any other medications. | .114 | 1 | .735 |
| Ho: There is no association of marital status and meeting doctor. | 1.279 | 3 | .734 |
| Ho: There is no association of marital status and kind of industry. | 1.353 | 2 | .509 |
| Ho: There is no association of marital status and habitat. | 25.655 | 21 | .220 |
| Ho: There is no association of marital status and sanitary system. | .230 | 2 | .891 |
| Ho: There is no association of marital status and kind of water drunk. | 6.306 | 2 | .043* |
| Ho: There is no association of marital status and usage of processed meat. | .120 | 2 | .942 |
| Ho: There is no association of marital status and usage of food additives. | .071 | 2 | .965 |
| Table 3c: Normality tests. | ||||
| Factors | N | Kolmogorov-Smirnov Test Statistic | Asymp. Sig. (2-tailed) | Conclusion |
| Ho: Physical activities are normal | 98 | 0.262 | 0.000 | Non normal |
| Ho: Daily activities are normal | 100 | 0.373 | 0.000 | Non normal |
| Ho: meals are normal | 98 | 0.164 | 0.000 | Non normal |
| Ho: Other complications are normal | 99 | 0.191 | 0.000 | Non normal |
| Ho: Blood sugar monitoring is normal | 99 | 0.255 | 0.000 | Non normal |
| Ho: medications are normal | 96 | 0.169 | 0.000 | Non normal |
| Ho: Environmental factors are normal | 98 | 0.185 | 0.000 | Non normal |
| Table 3d: Testing of patient’s gender with the factors. | |||
| No. | Alternative Hypothesis | U | p- value |
| 1 | Gender effects physical activities | 1100.000 | 0.985 |
| 2 | Gender effects daily activities | 953.000 | 0.146 |
| 3 | Gender effects meals | 862.000 | 0.071 |
| 4 | Gender effects other complications | 862.500 | 0.042* |
| 5 | Gender effects blood sugar monitoring | 999.500 | 0.308 |
| 6 | Gender effects medications | 890.500 | 0.168 |
| 7 | Gender effects environmental factors | 905.500 | 0.109 |
| Table 3e: Habitat with other factors. | |||
| No. | Alternative Hypothesis | U | p - value |
| 1 | Habitat effects physical activities | 896.500 | 0.185 |
| 2 | Habitat effects daily activities | 1060.500 | 0.751 |
| 3 | Habitat effects meals | 987.000 | 0.456 |
| 4 | Habitat effects other complications | 885.000 | 0.096 |
| 5 | Habitat effects blood sugar monitoring | 975.000 | 0.325 |
| 6 | Habitat effects medications | 711.000 | 0.010* |
| 7 | Habitat effects environmental factors | 379.000 | 0.000* |
We would like to oblige University of the Punjab, Lahore for funds and Ms. Aasma Riaz (Assistant Professor Statistics Department, University of the Punjab, Lahore) for analysis of statistics of data.
- World Health Organization. Country Profiles: Pakistan. World Health Organization. 2018.
- Wild S, Roglic G, Green A, Sicree R, King H. Global prevalence of diabetes: estimates for the year 2000 and projections for 2030: response to Rathman and Giani. Diabetes care. 2004; 27: 2568-2569. PubMed: https://pubmed.ncbi.nlm.nih.gov/15451946/
- Shoback DG, Gardner D, eds. Diabetes mellitus. Greenspan's basic & clinical endocrinology Chapter 17. (9th ed.). New York: McGraw-Hill Medical. 2011.
- World Health Organization. Definition, diagnosis and classification of diabetes mellitus and its complications: report of a WHO consultation. Part 1, Diagnosis and classification of diabetes mellitus, Geneva: World health organization. 1999.
- Michalek JE, Pavuk M. Diabetes and cancer in veterans of Operation Ranch Hand after adjustment for calendar period, days of spraying, and time spent in Southeast Asia. J Occup Environ Med. 2008; 50: 330-340. PubMed: https://pubmed.ncbi.nlm.nih.gov/18332783/
- Kang ES, Kim HJ, Nam M, Nam CM, Ahn CW, et al. A novel 111/121 diplotype in the Calpain-10 gene is associated with type 2 diabetes. J Hum Genet. 2006; 51: 629-633. https://pubmed.ncbi.nlm.nih.gov/16721485/
- Yi B, Hu X, Zhang H, Huang J, Liu J, et al. Nuclear NF-κB p65 in peripheral blood mononuclear cells correlates with urinary MCP-1, RANTES and the severity of type 2 diabetic nephropathy. PLoS One. 2014; 9: e99633. PubMed: https://pubmed.ncbi.nlm.nih.gov/24936866/
- Kuo CC, Moon K, Thayer KA, Navas-Acien A. Environmental chemicals and type 2 diabetes: an updated systematic review of the epidemiologic evidence. Curr Diab Rep. 2013; 13: 831-849. PubMed: https://pubmed.ncbi.nlm.nih.gov/24114039/
- Fernández JS. Iron Excess and Risk of Type 2 Diabetes Mellitus in a Prospective Cohort of Mediterranean Population. Cambridge Core. 2016; 112:
- Kanan S, Samara S. Dioxins and furans: A review from chemical and environmental perspectives. Trends in Environmental Analytical Chemistry. 2018; 17: 1-13.
- Kitabchi AE, Umpierrez GE, Miles JM, Fisher JN. Hyperglycemic crises in adult patients with diabetes. Diabetes Care. 2009; 32: 1335–1343. PubMed: https://www.ncbi.nlm.nih.gov/pmc/articles/PMC2699725/
- Pourfarzam M, Zadhoush F, Sadeghi M. The difference in correlation between insulin resistance index and chronic inflammation in type 2 diabetes with and without metabolic syndrome. Adv Biomed Res. 2016; 5: 153. PubMed: https://www.ncbi.nlm.nih.gov/pmc/articles/PMC5046740/